Real-time analysis and forecasting of influenza virus evolution
Richard Neher
Biozentrum, University of Basel
slides at neherlab.org/201803_IMRP.html
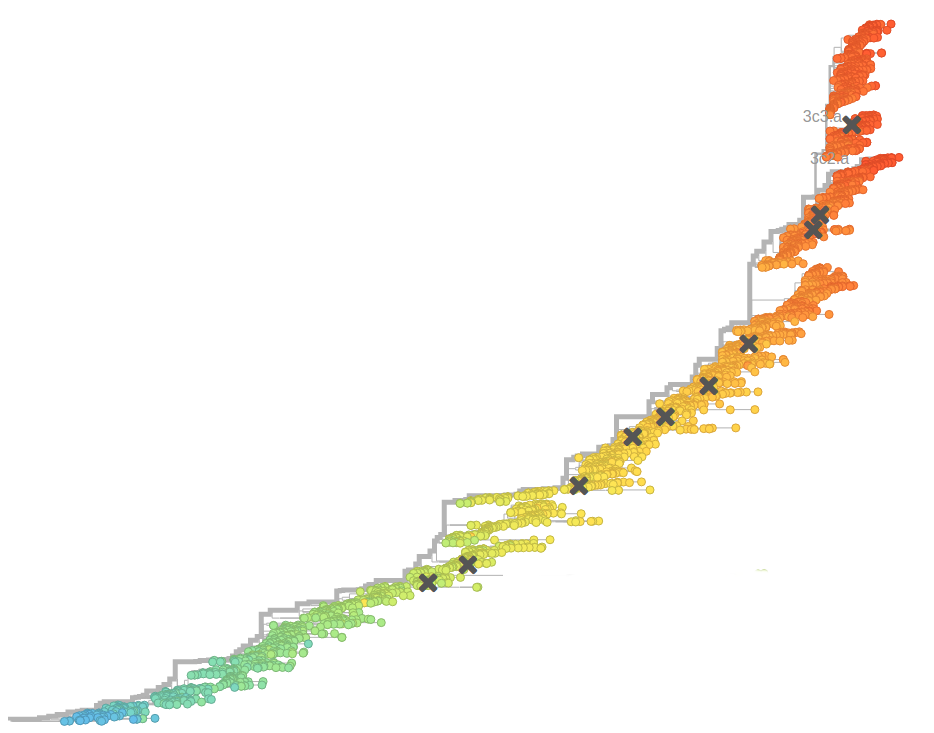
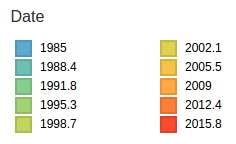
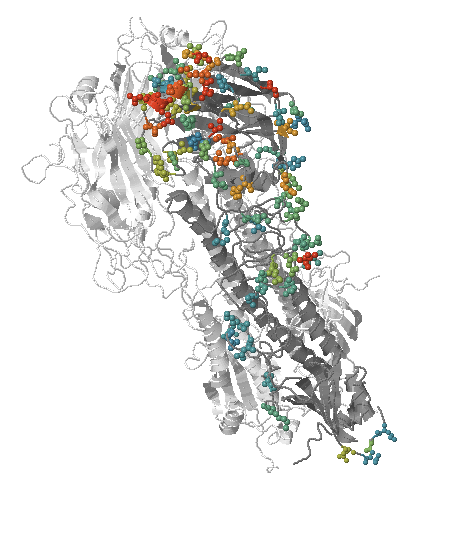
- Influenza viruses evolve to avoid human immunity
- Vaccines need frequent updates

Large scale sequencing -- A/H3N2 genomes in GISAID

Joint work with....


- Boris Shraiman
- Colin Russell
- Trevor Bedford


nextflu.org
joint work with Trevor Bedford & his lab
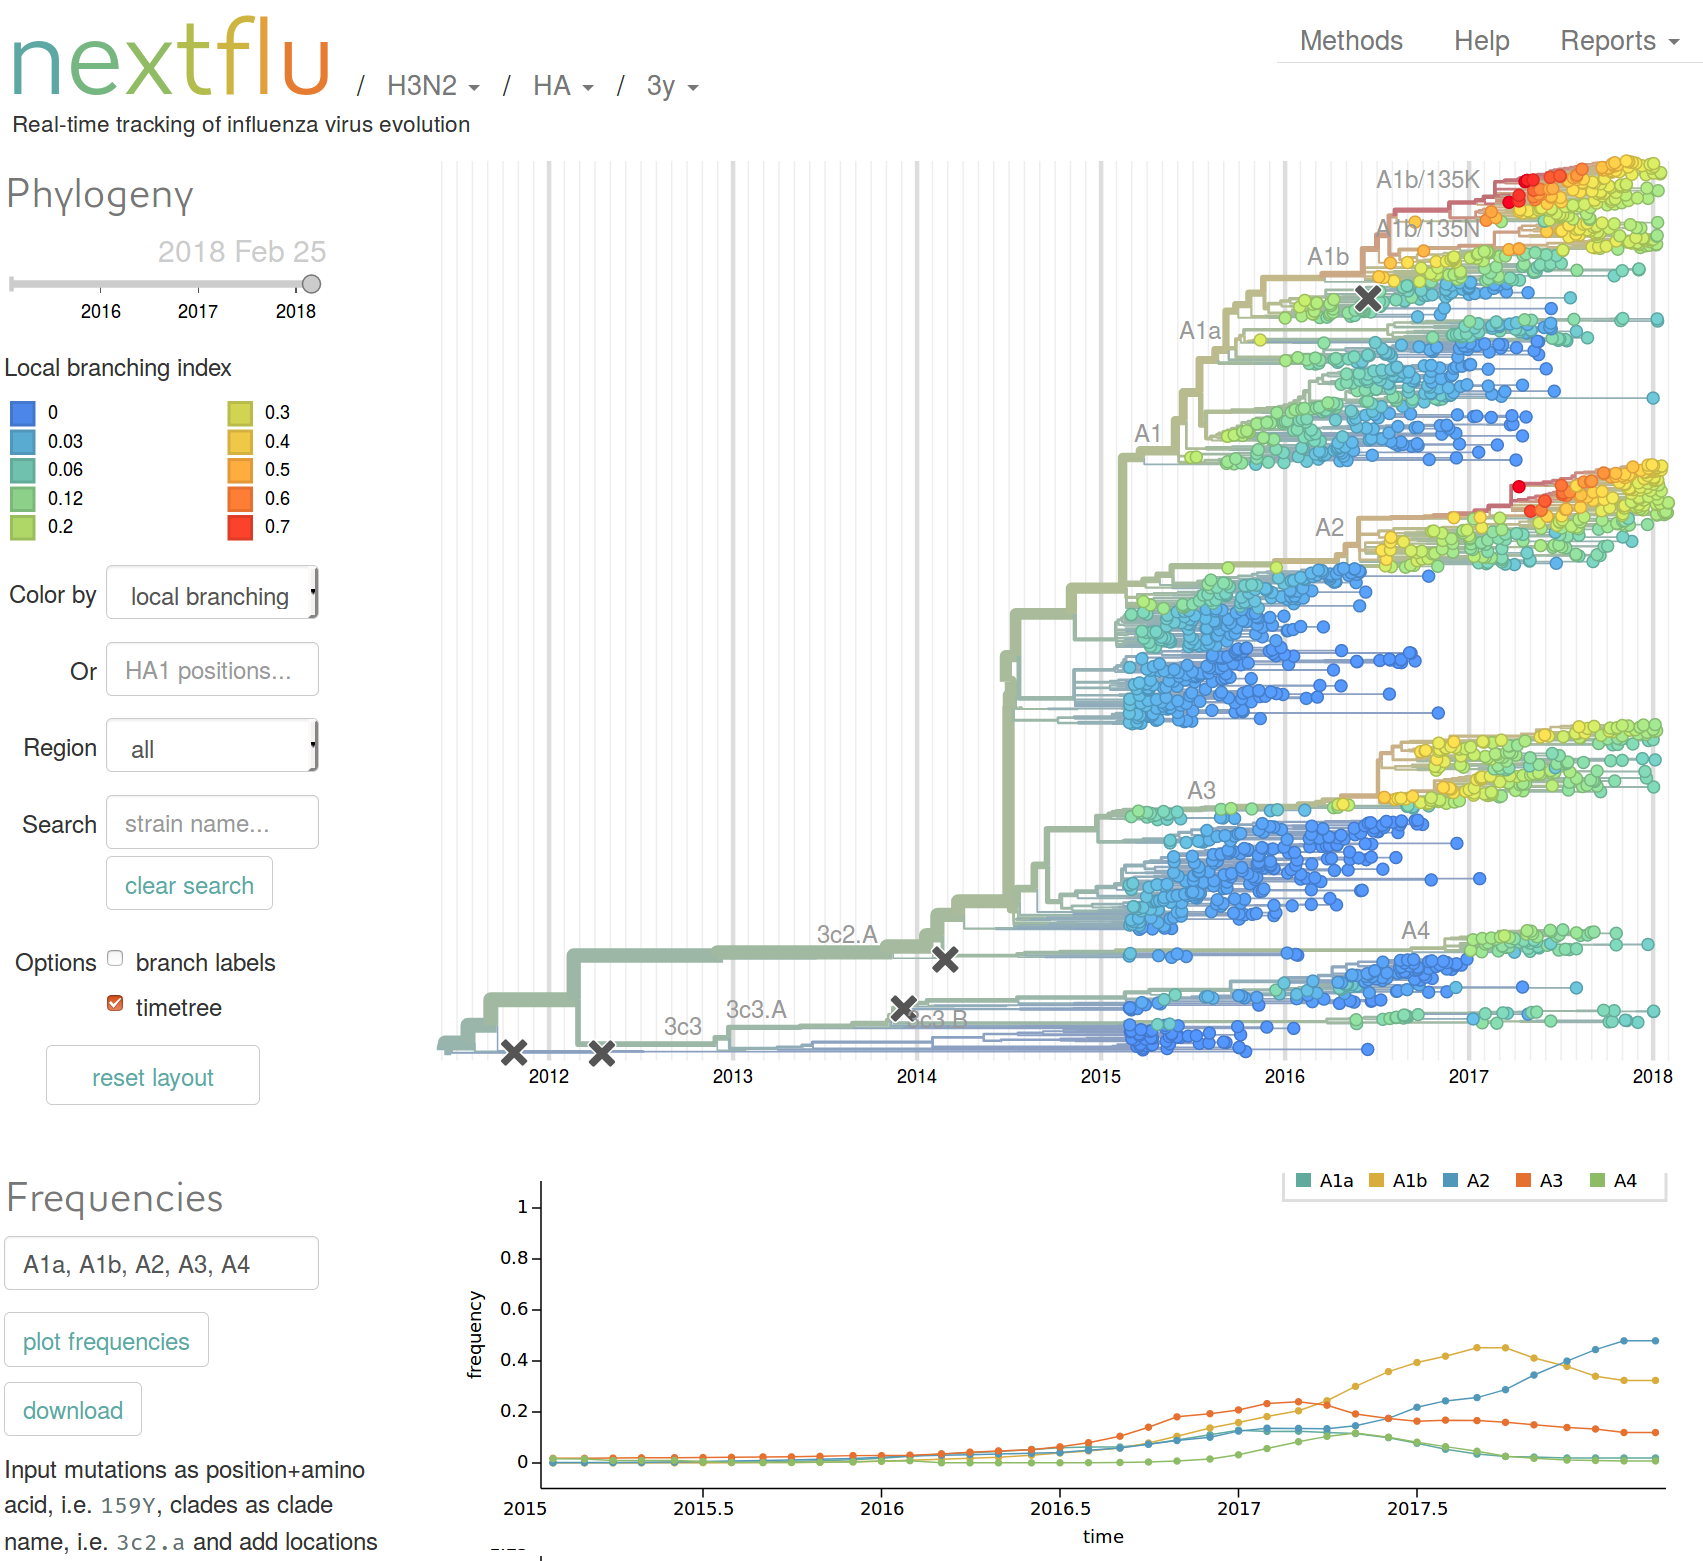
Features
- Maps mutations to the tree
- Calculates frequency trajectories of every major mutation
- Allows subsetting of data to date ranges and geographic region
- Time-scaled and standard phylogenetic trees
- Updated frequently, reflects GISAID data
- Integrates HI data and molecular evolution data
Beyond tracking: can we predict?
Different approaches to predict IAV evolution
- extrapolation of current frequency trajectories
- sampling bias can affect this dramatically
- explicit fitness score based on historical patterns (Lukzsa and Lässig)
- epitope mutations
- other mutations -- interfere with virus function
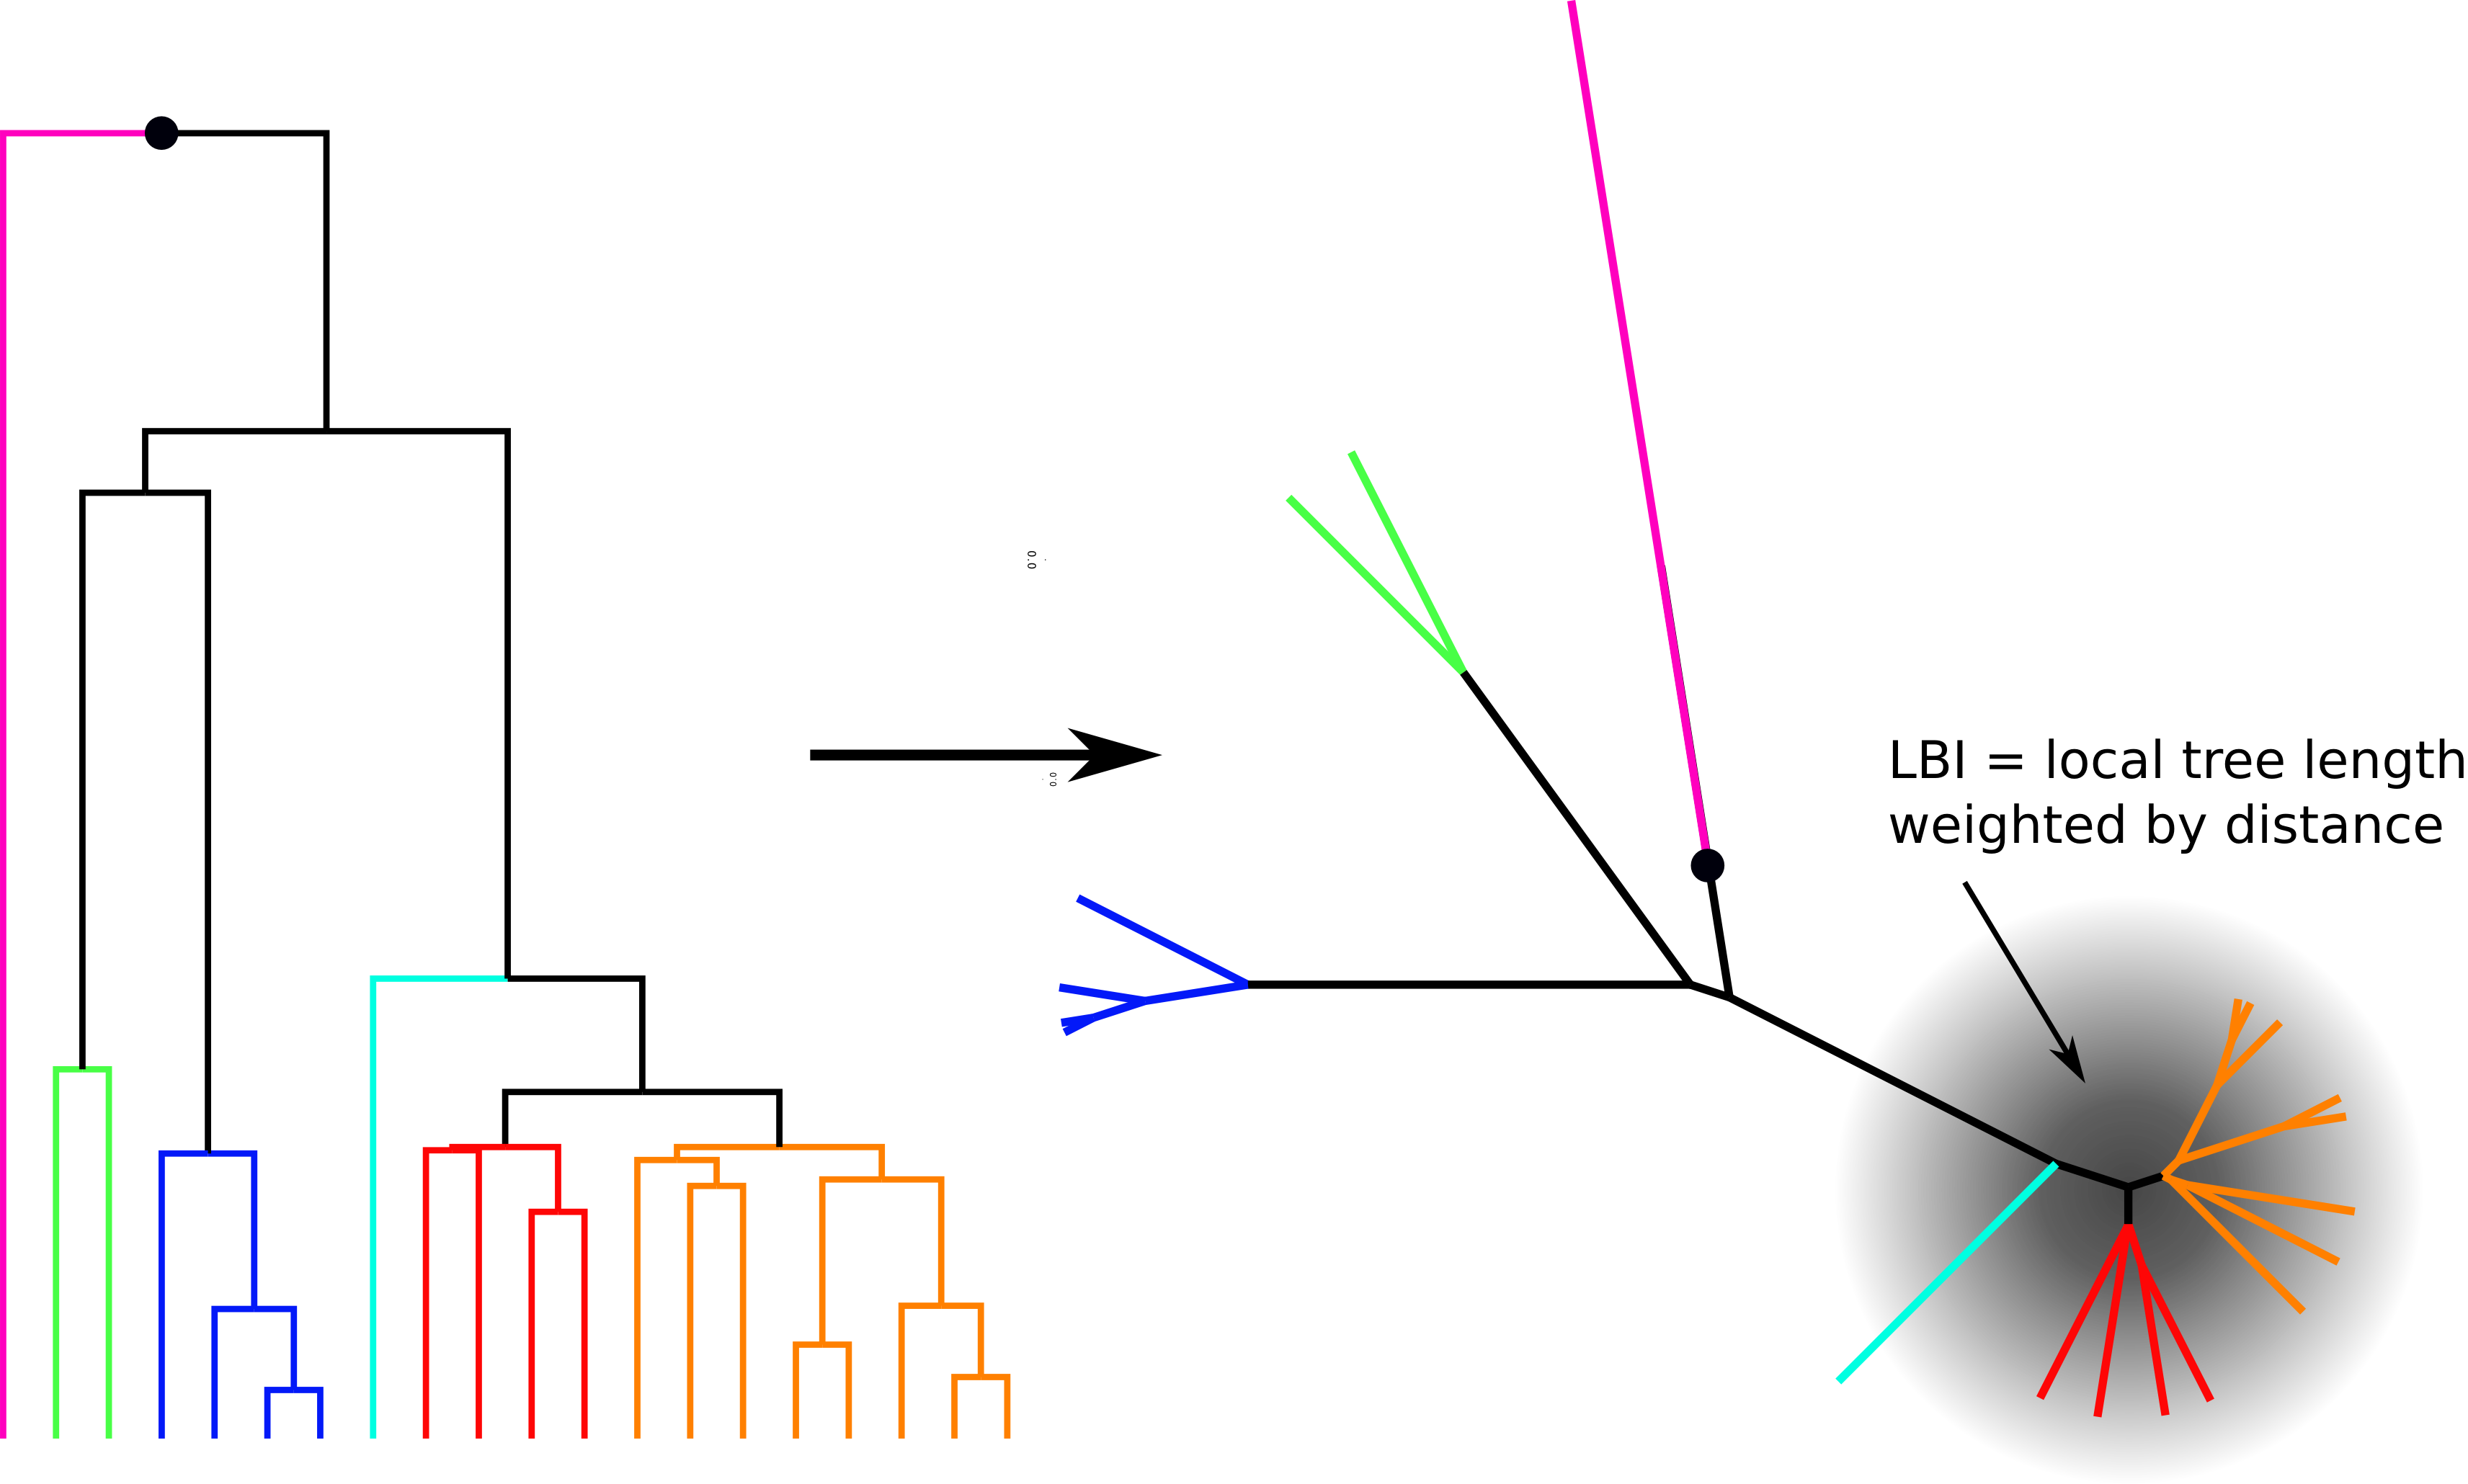
- fitness inference from branching patterns in the tree (RN, Russell, Shraiman)
- requires no historical data
- not influenza specific
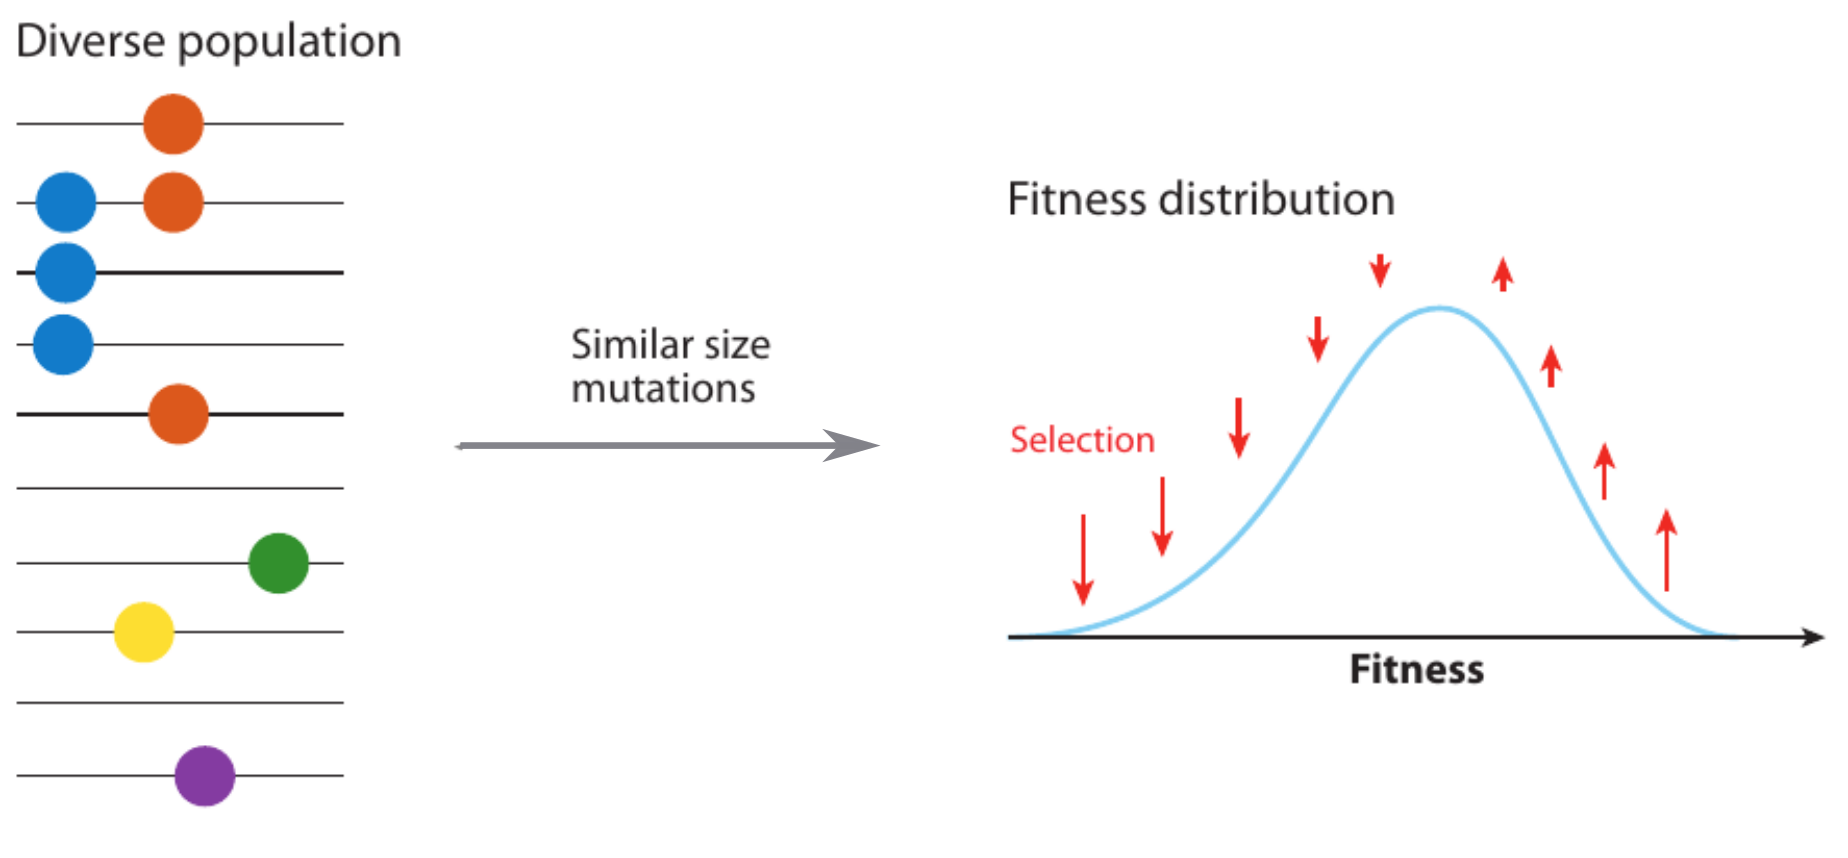
Model of an adapting influenza virus population
Typical tree
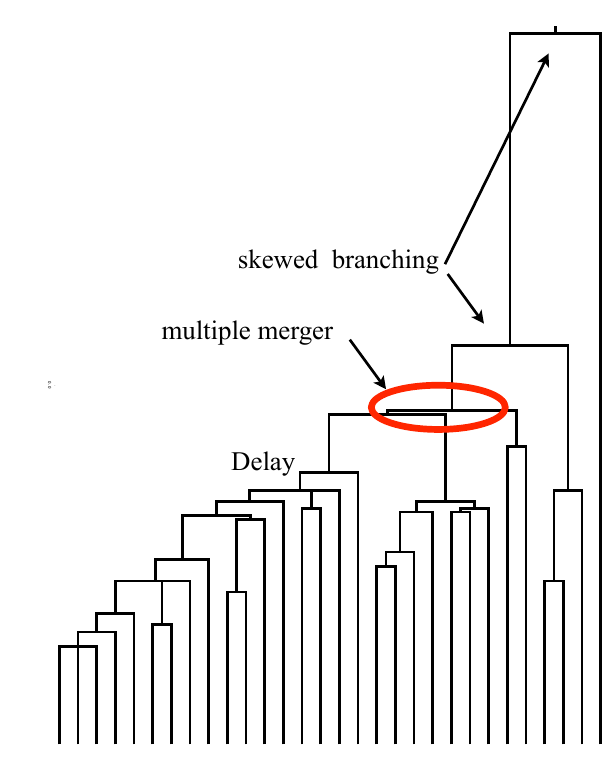
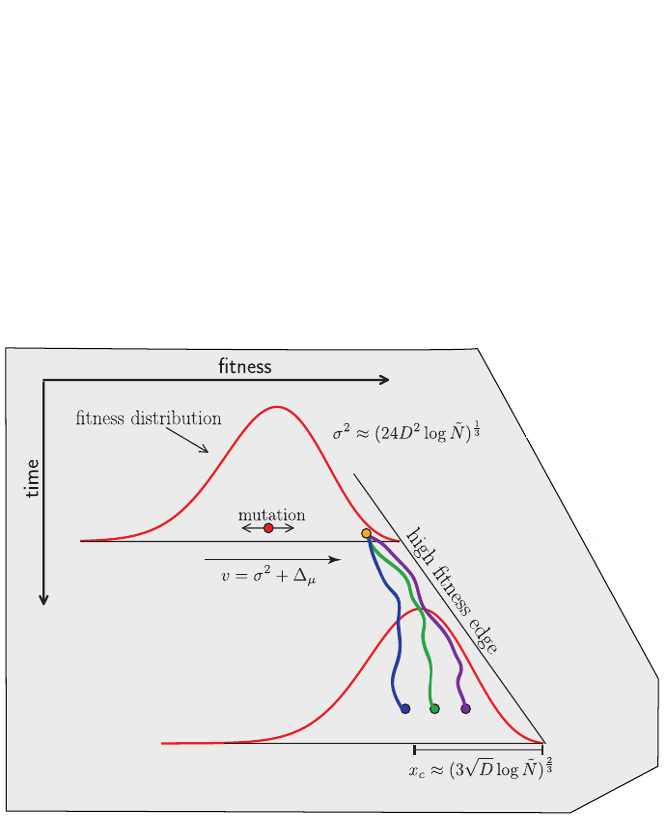
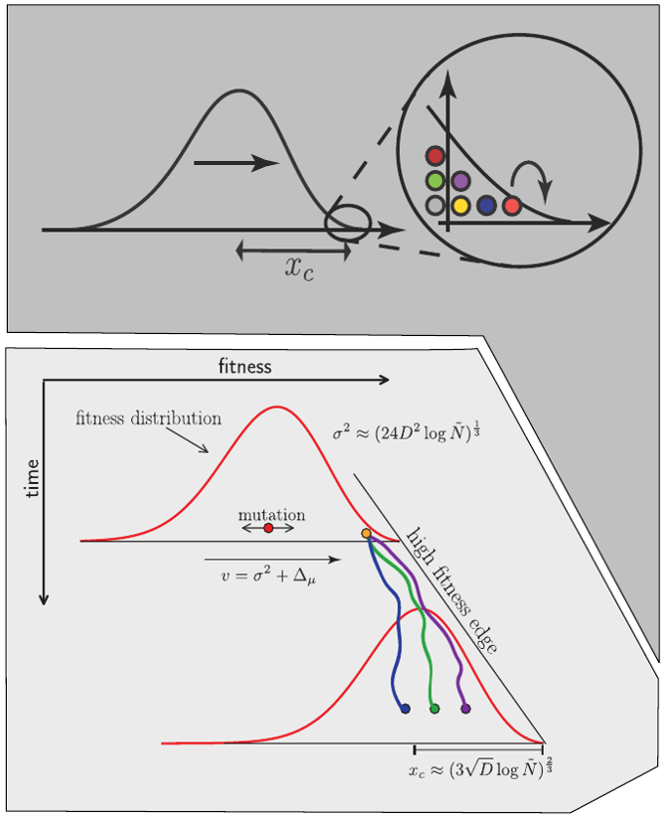
Bolthausen-Sznitman Coalescent
Bursts in a tree ↔ high fitness genotypes
Fitness inference from trees
$$P(\mathbf{x}|T) = \frac{1}{Z(T)} p_0(x_0) \prod_{i=0}^{n_{int}} g(x_{i_1}, t_{i_1}| x_i, t_i)g(x_{i_2}, t_{i_2}| x_i, t_i)$$
RN, Russell, Shraiman, eLife, 2014
Validation on simulated data
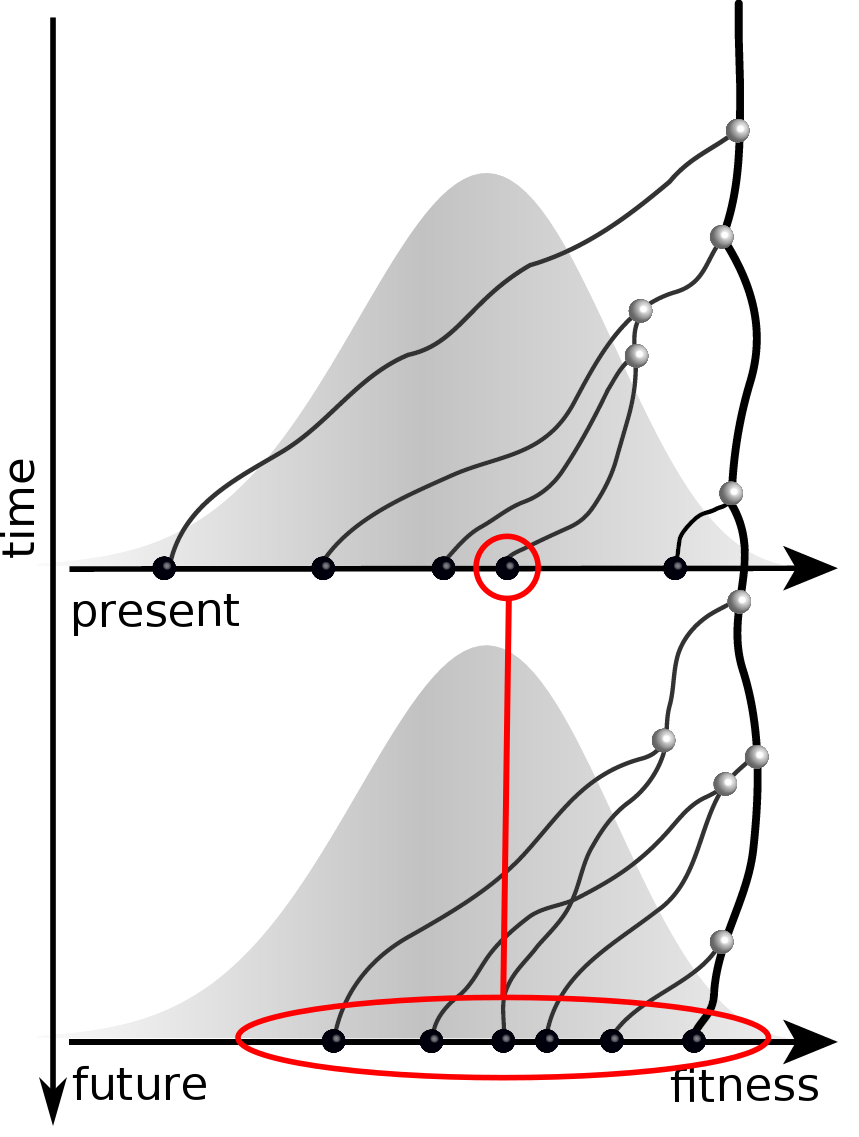
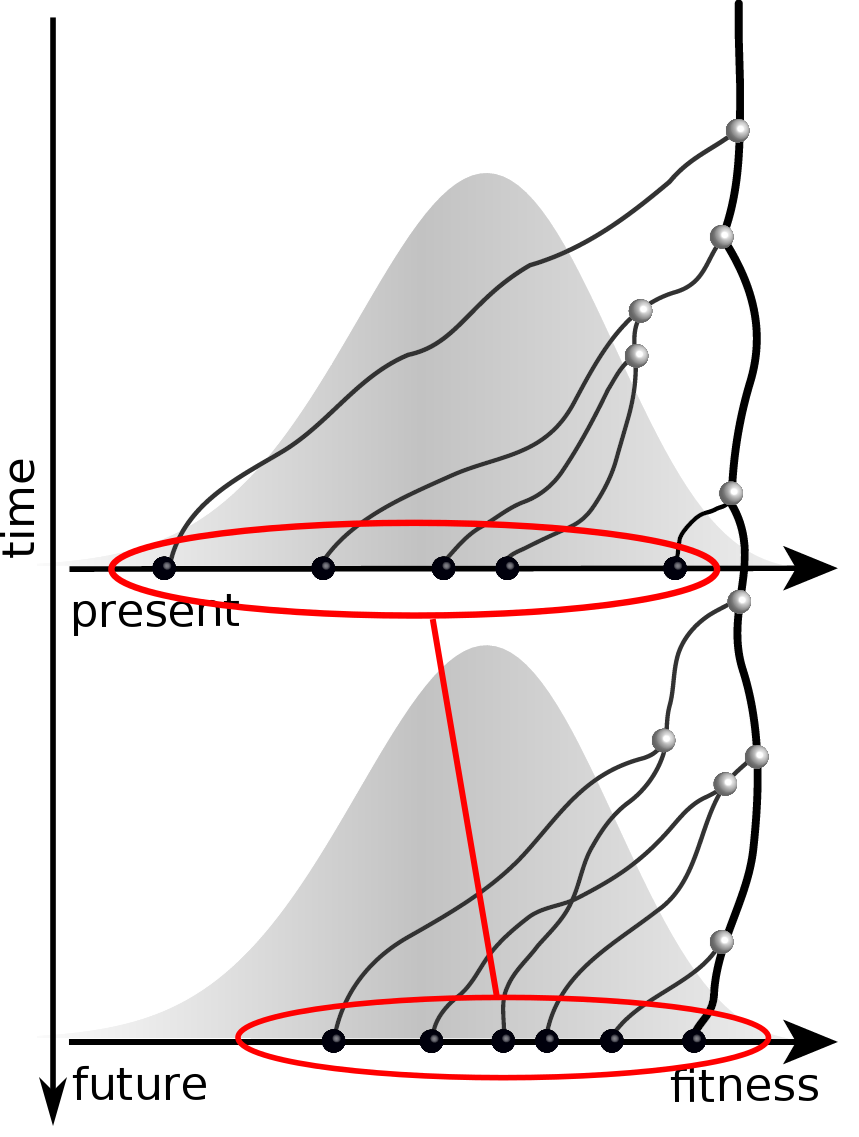
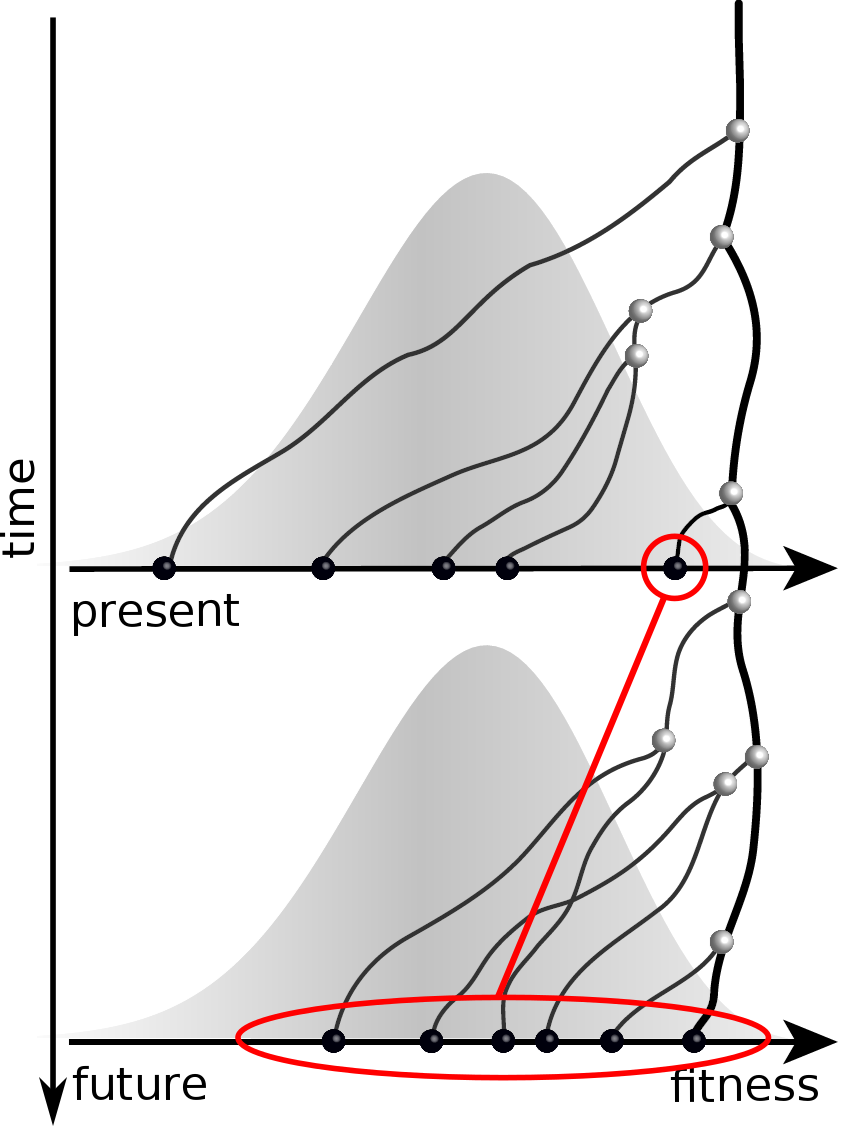
Prediction of the dominating H3N2 influenza strain
- Since 2015: Reports with (conservative) predictions are available on nextflu.org
Sept 2015: "3c2.a will continue to dominate"

Feb 2016: "...we predict the HA1:171K (now 3c2.a1) variant to dominate..."

Sep 2016: "...we predict that clade 3c2.a1 variant to dominate, but..."

Feb 2017: "...we predict clades 171K/121K (3c2.a1a) and 131K/142K (3c2.a2) to be successful..."

Sep 2017: "...we think clades 3c2.a1a/135K, 3c2.a2, 3c2.a3 are competitive"

A reassortant dominated A/H3N2 circulating this past season

HI data sets
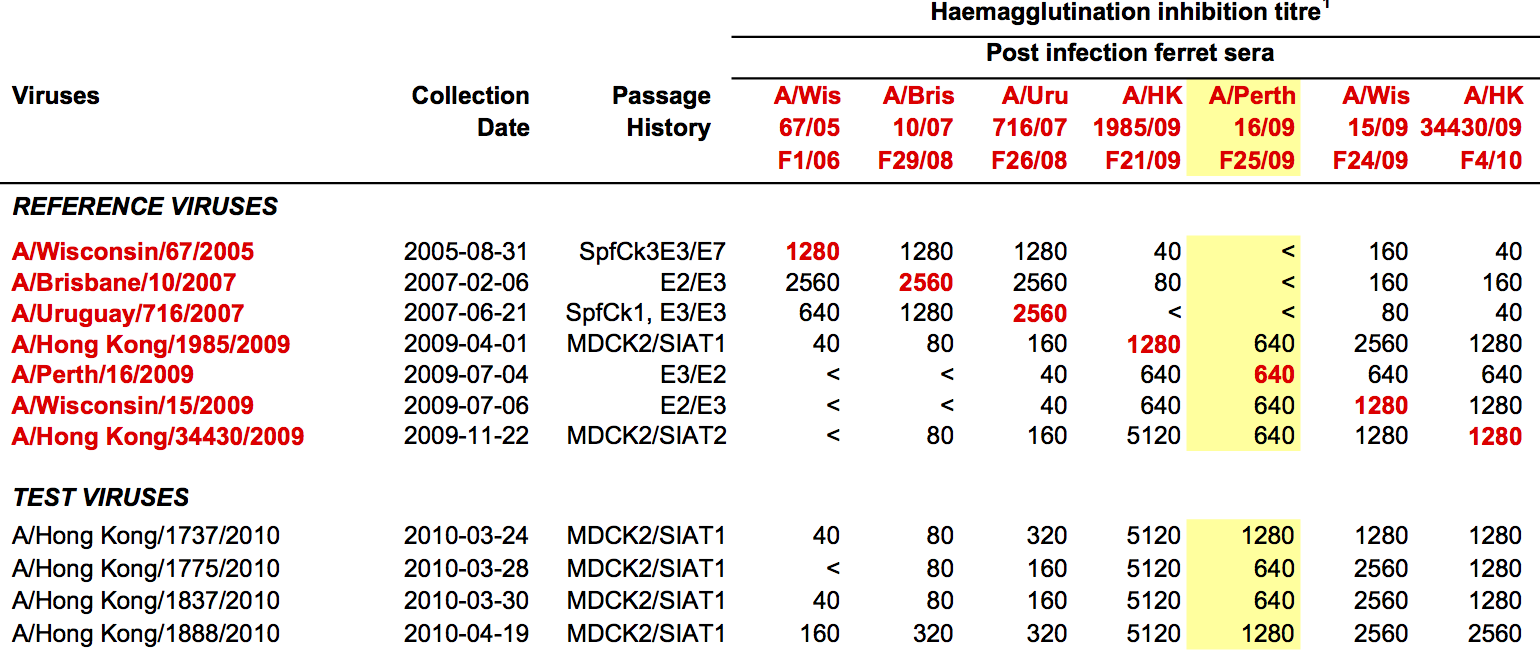
- Long list of distances between sera and viruses
- Tables are sparse, only close by pairs
- Structure of space is not immediately clear
- MDS in 2 or 3 dimensions
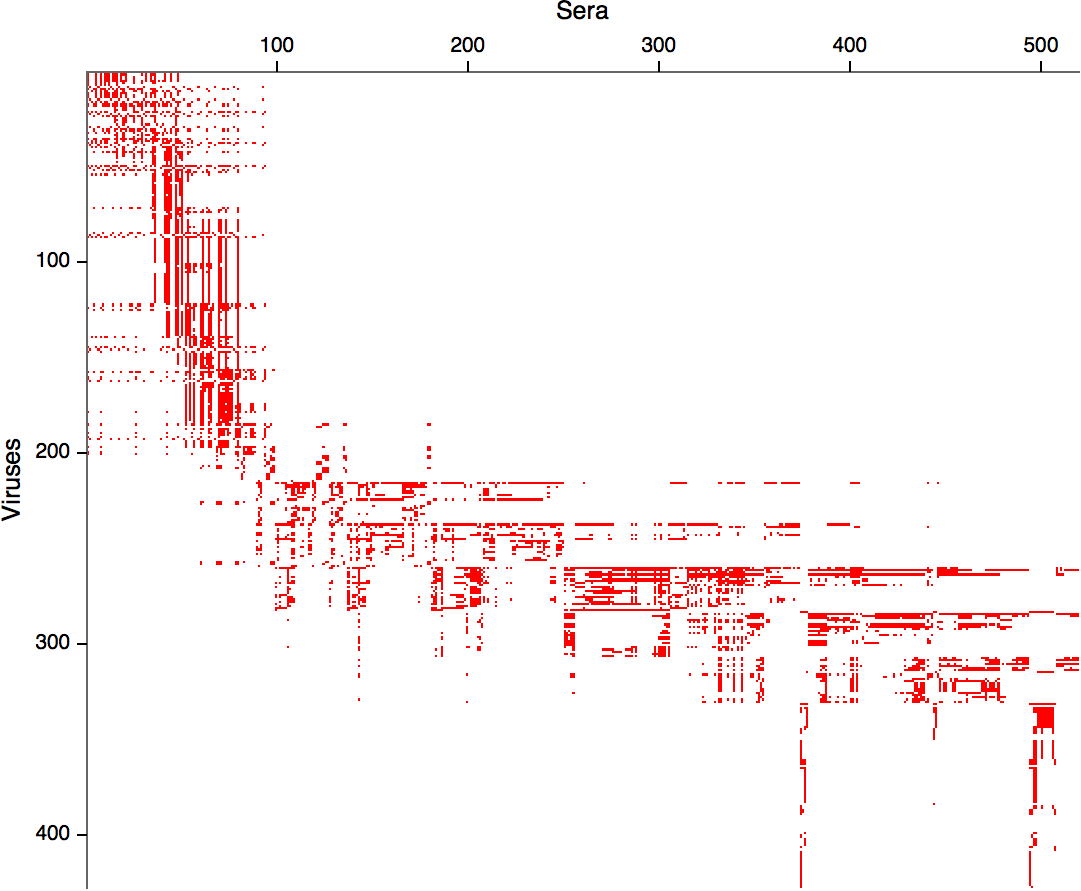
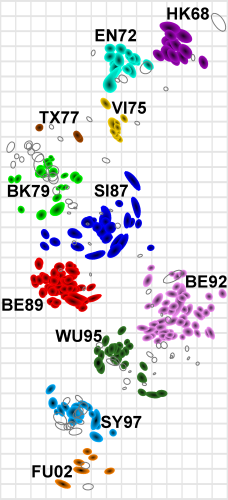 Smith et al, Science 2002
Integrating antigenic and molecular evolution
- $H_{a\beta} = v_a + p_\beta + \sum_{i\in (a,b)} d_i$
- each branch contributes $d_i$ to antigenic distance
- sparse solution for $d_i$ through $l_1$ regularization
- related model where $d_i$ are associated with substitutions
Integrating antigenic and molecular evolution
- MDS: $(d+1)$ parameters per virus
- Tree model: $2$ parameters per virus
- Sparse solution
→ identify branches or substitutions that cause titer drop
Rate of antigenic evolution
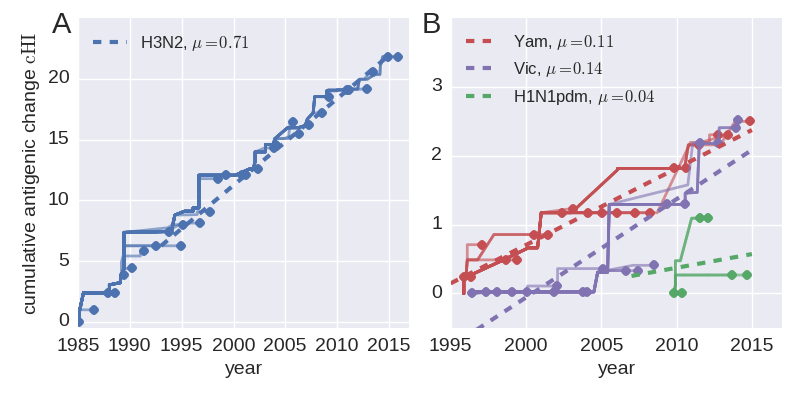
- Cumulative antigenic evolution since the root: $\sum_i d_i$
- A/H3N2 evolves faster antigenically
- A/H3N2 has a more rapid population turn-over
- Proportion of children is high in B vs A/H3N2 infections
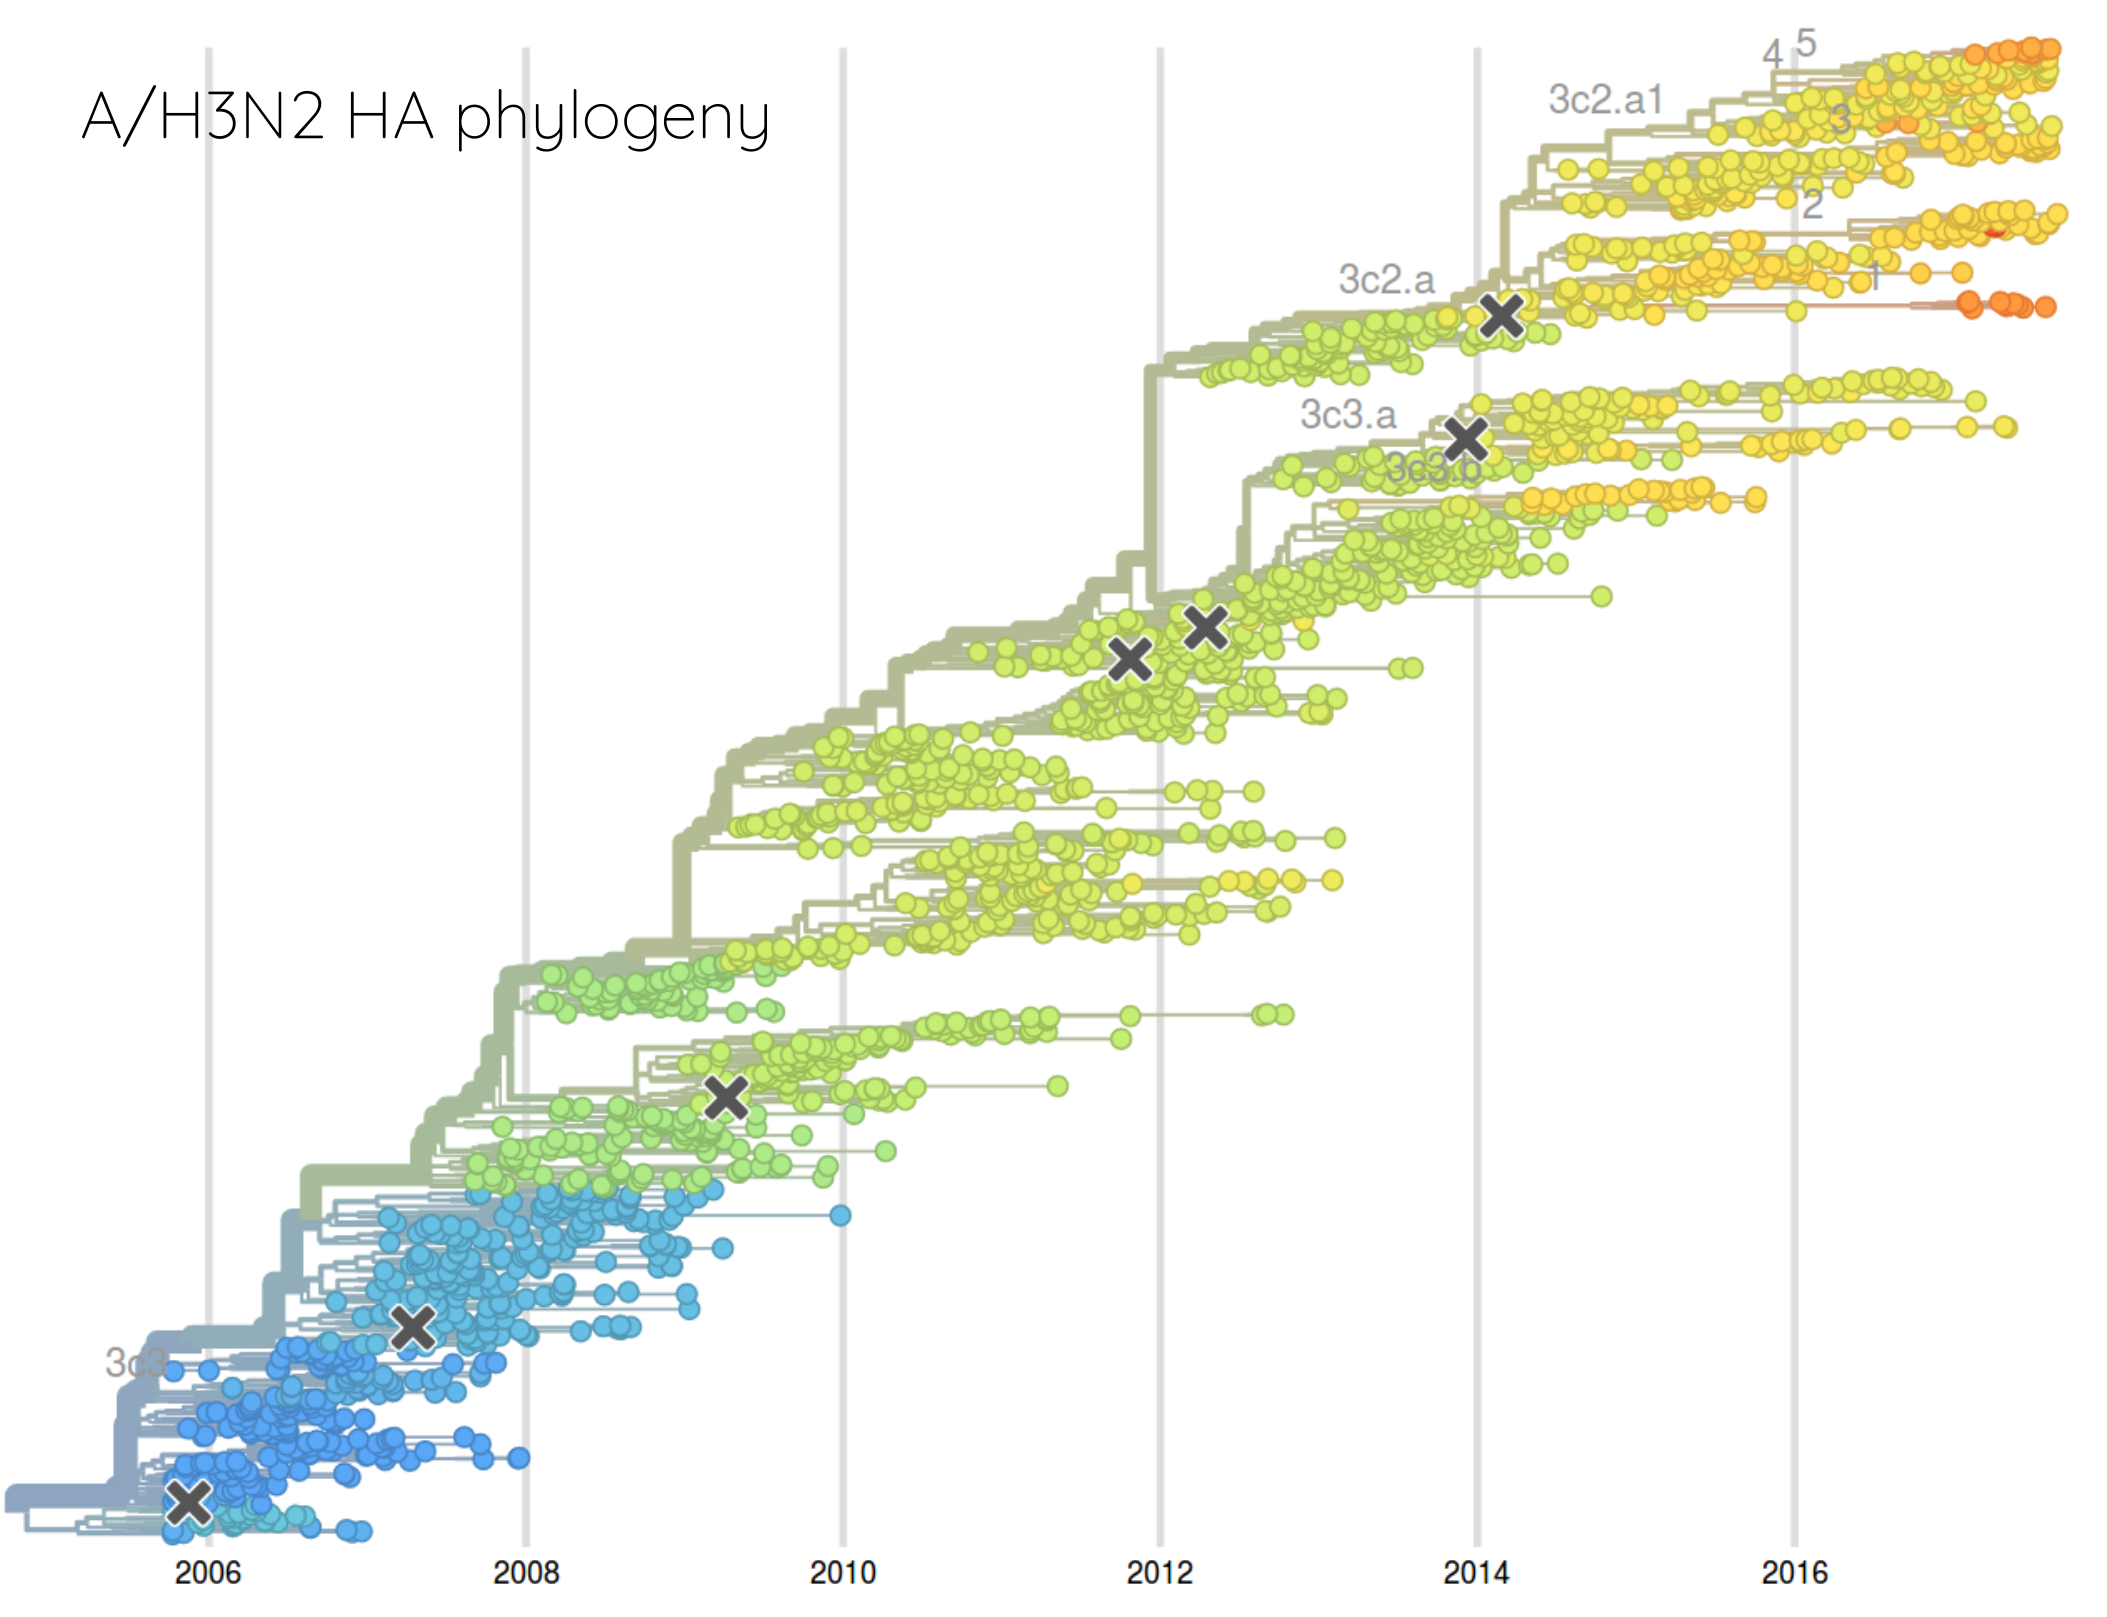
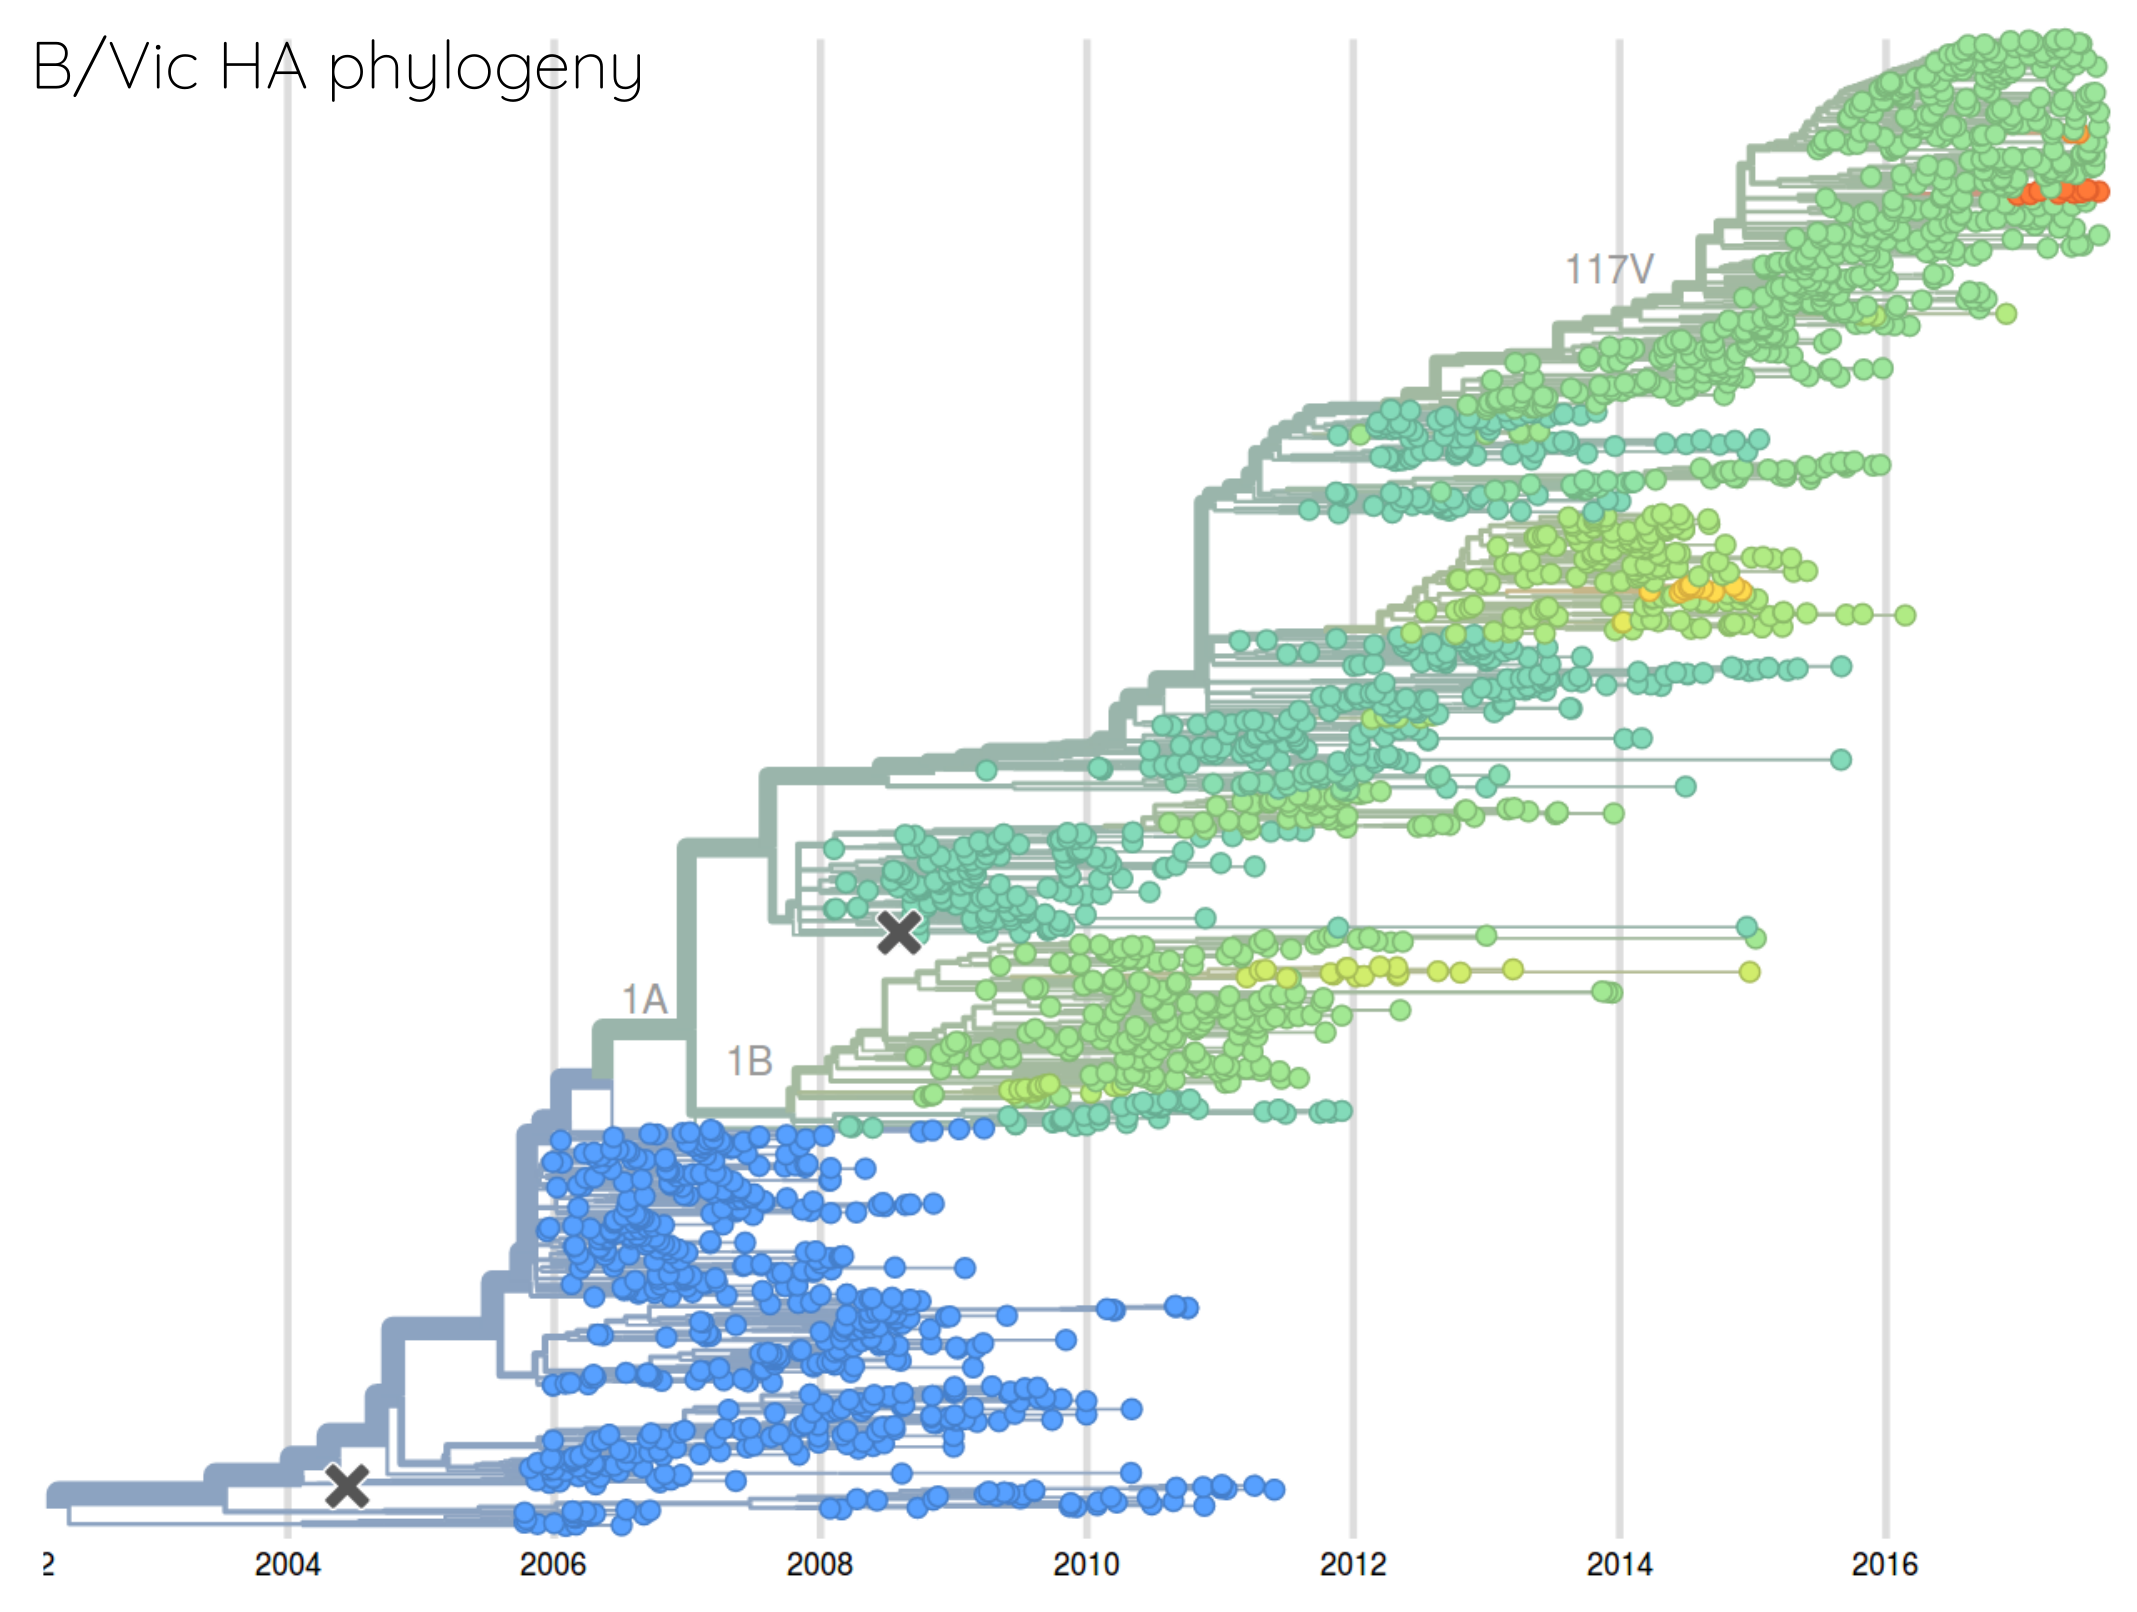
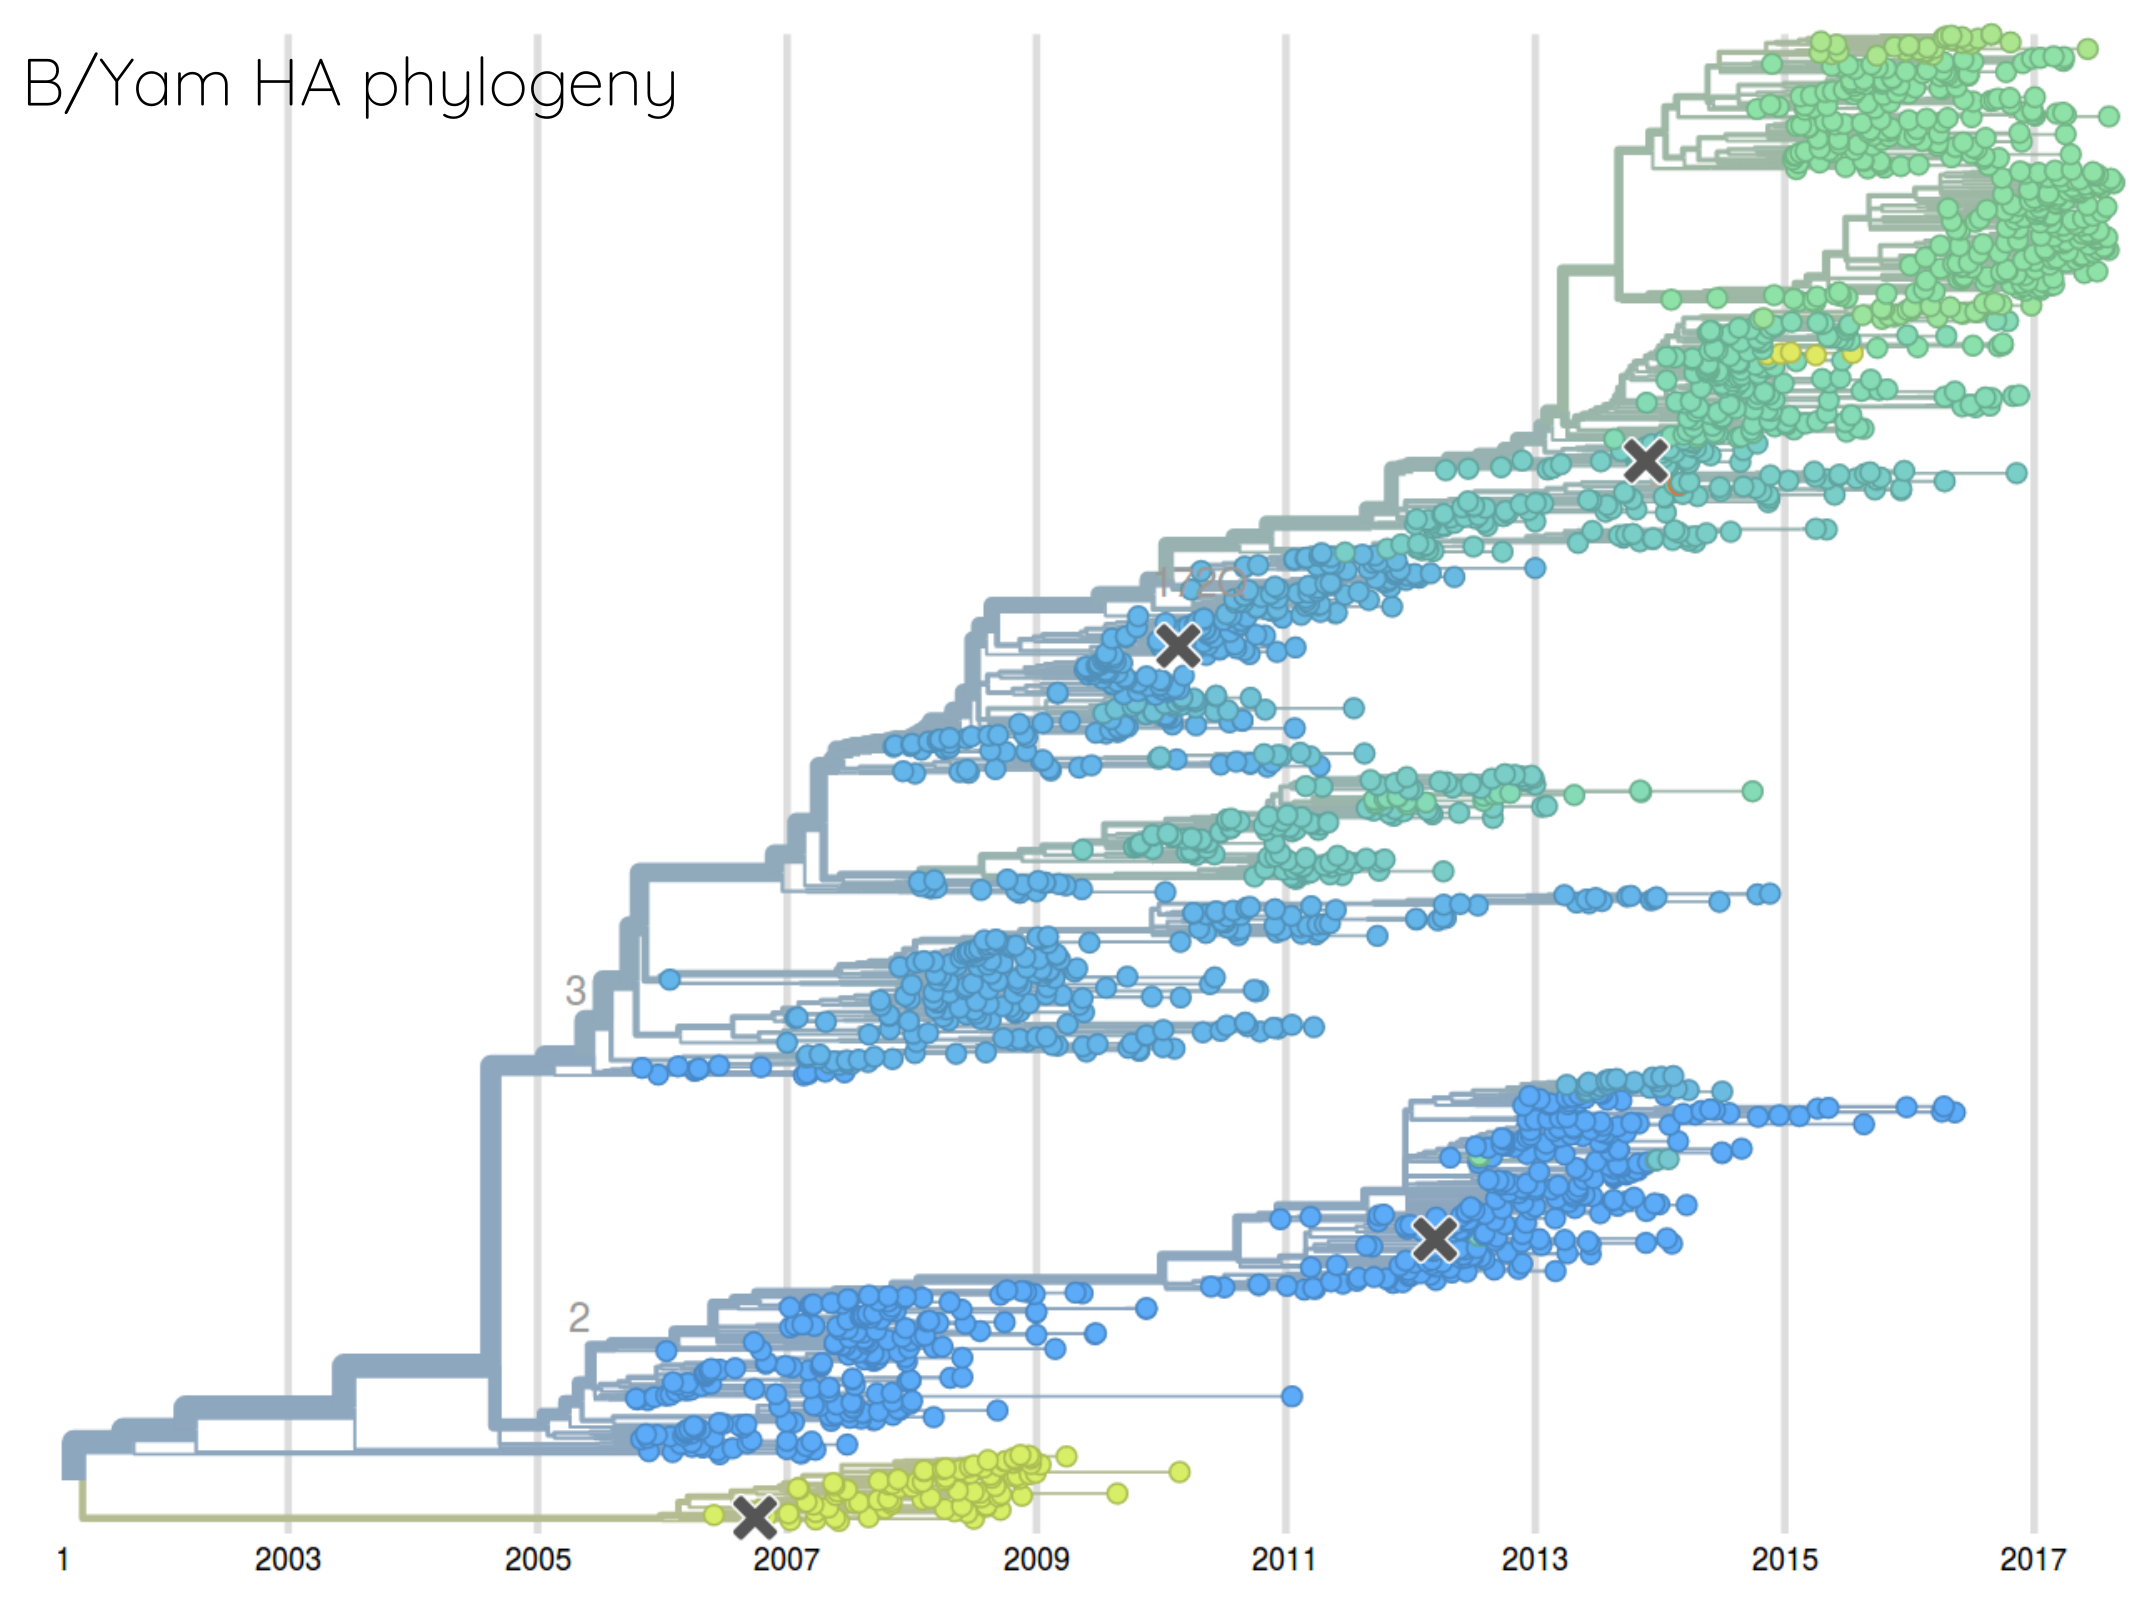
How many sites are involved?

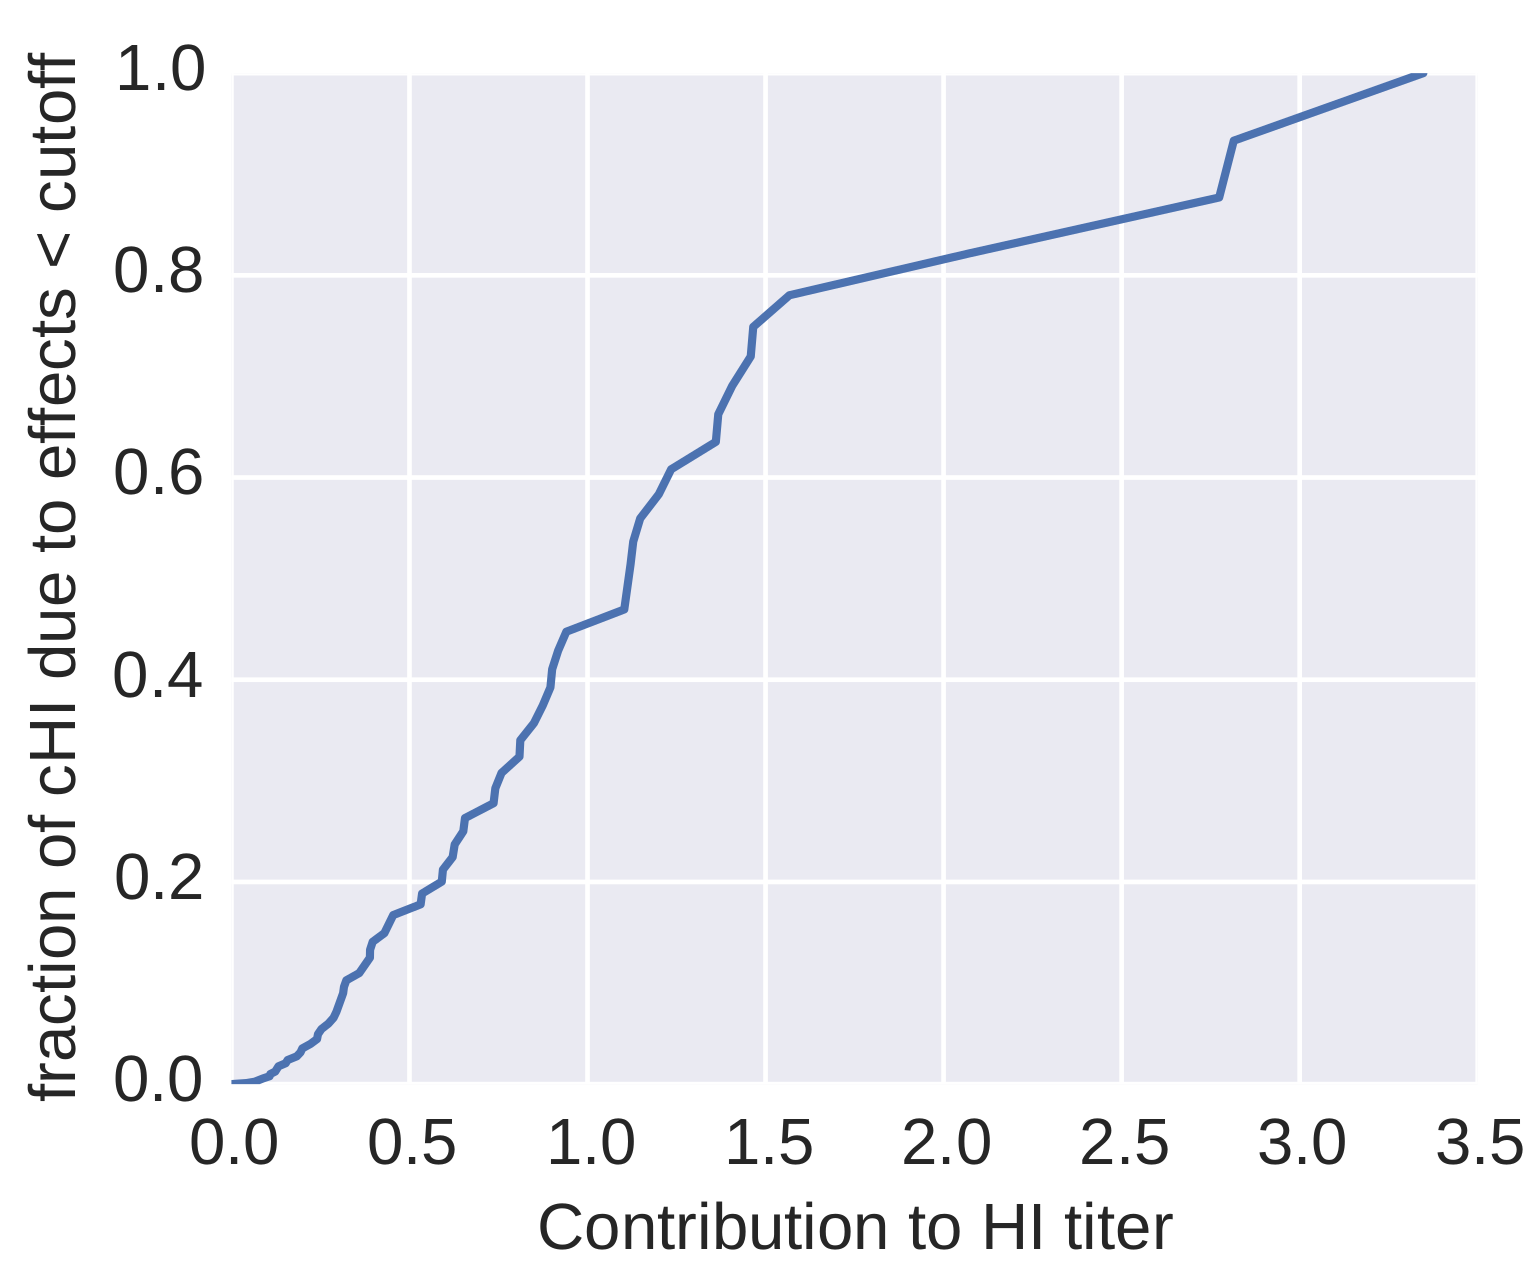
| Mutation | effect |
| K158N/N189K | 3.64 |
| K158R | 2.31 |
| K189N | 2.18 |
| S157L | 1.29 |
| V186G | 1.25 |
| S193F | 1.2 |
| K140I | 1.1 |
| F159Y | 1.08 |
| K144D | 1.08 |
| K145N | 0.91 |
| S159Y | 0.89 |
| I25V | 0.88 |
| Q1L | 0.85 |
| K145S | 0.85 |
| K144N | 0.85 |
| N145S | 0.85 |
| N8D | 0.73 |
| T212S | 0.69 |
| N188D | 0.65 |
Exploring HI data relative to individual sera

nextflu and nextstrain.org


- Trevor Bedford
- Colin Megill
- Pavel Sagulenko
- Sidney Bell
- James Hadfield
- Wei Ding


