Real-time tracking of RNA virus evolution and spread
Richard Neher
Biozentrum & SIB, University of Basel
slides at neherlab.org/201905_ECDC.html
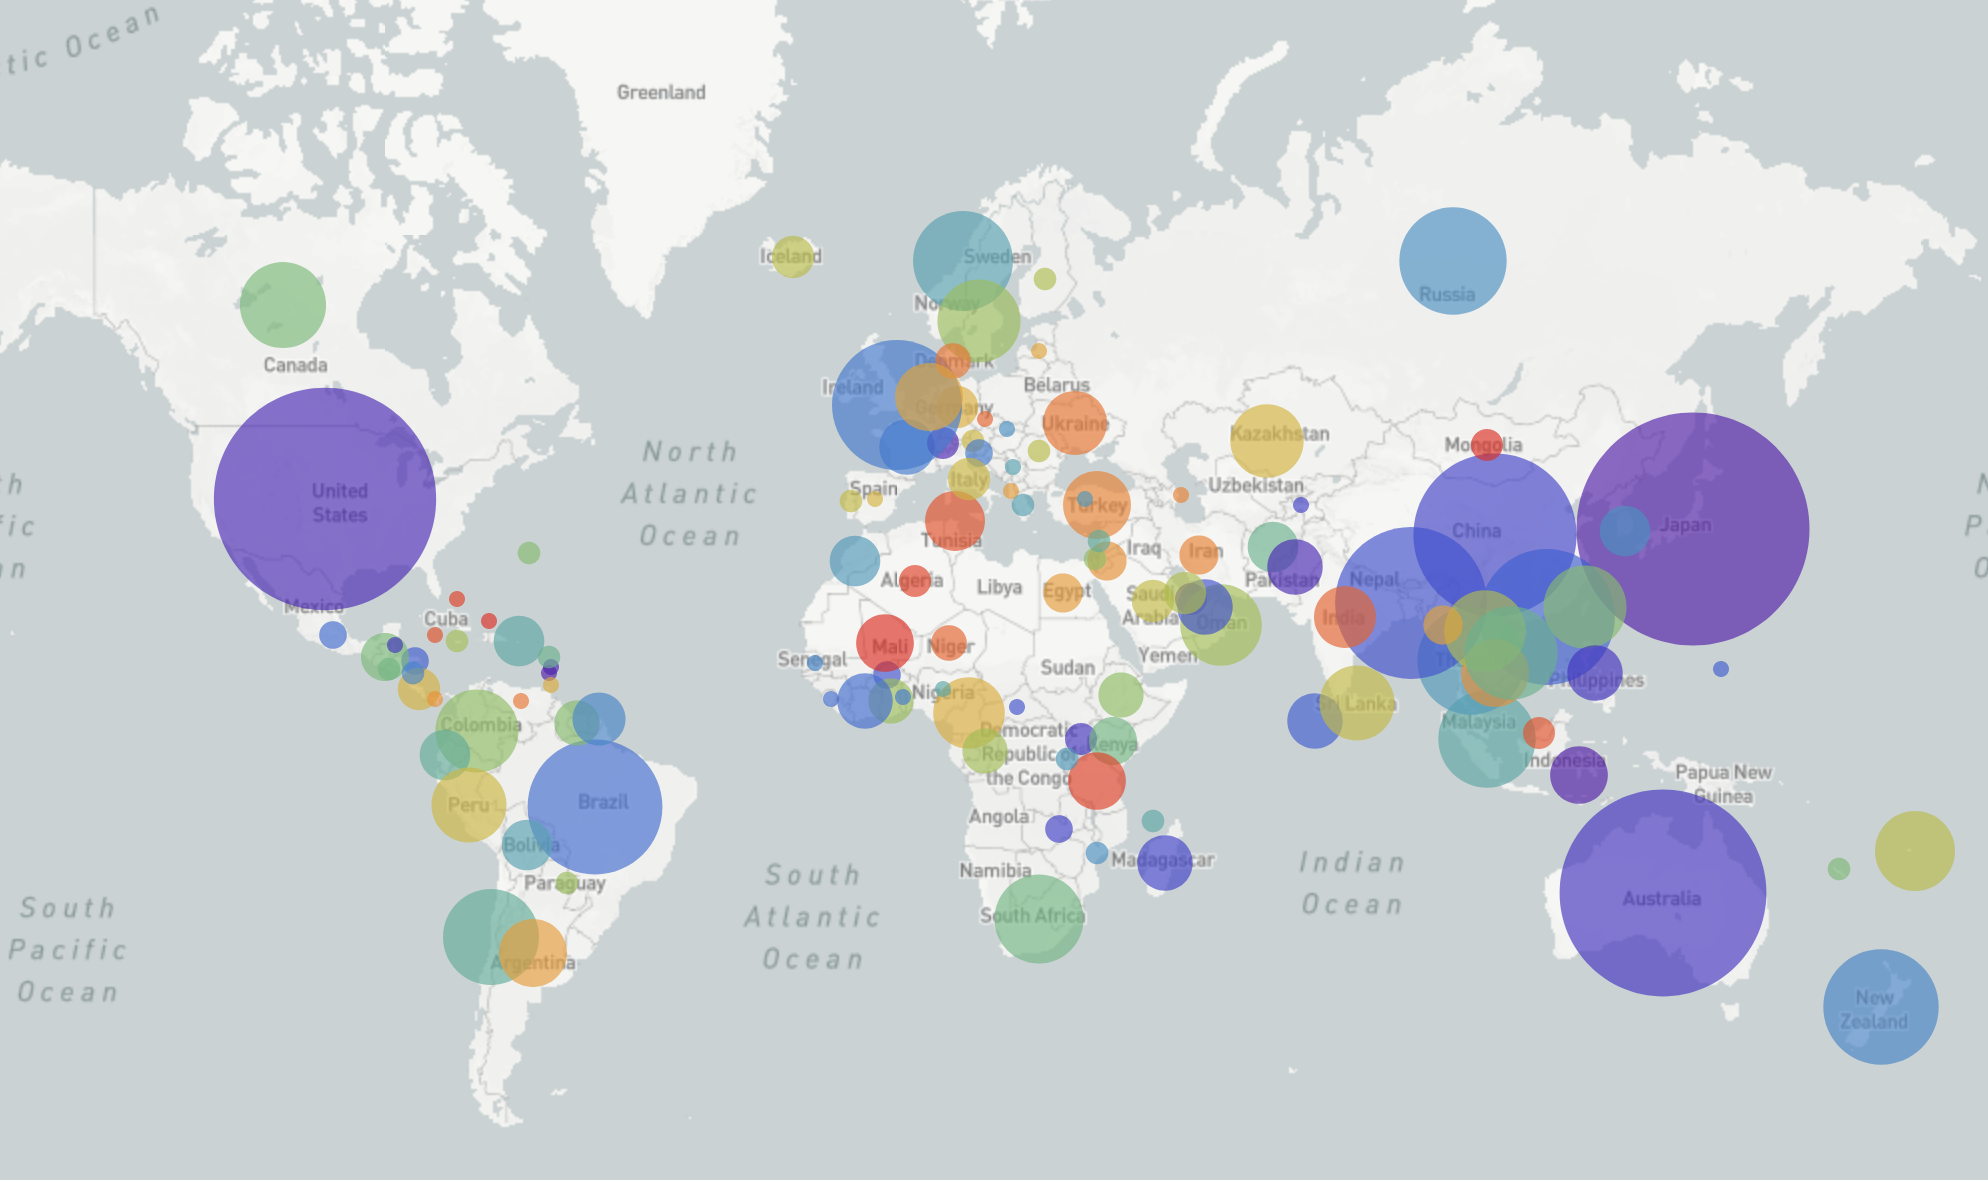
GISRS and GISAID -- Influenza virus surveillance
- comprehensive coverage of the world
- timely sharing of data -- often within 2-3 weeks of sampling
- hundreds of sequences per week (in peak months)
→ requires continuous analysis and easy dissemination
→ interpretable and intuitive visualization
nextflu.org
joint project with Trevor Bedford & his lab
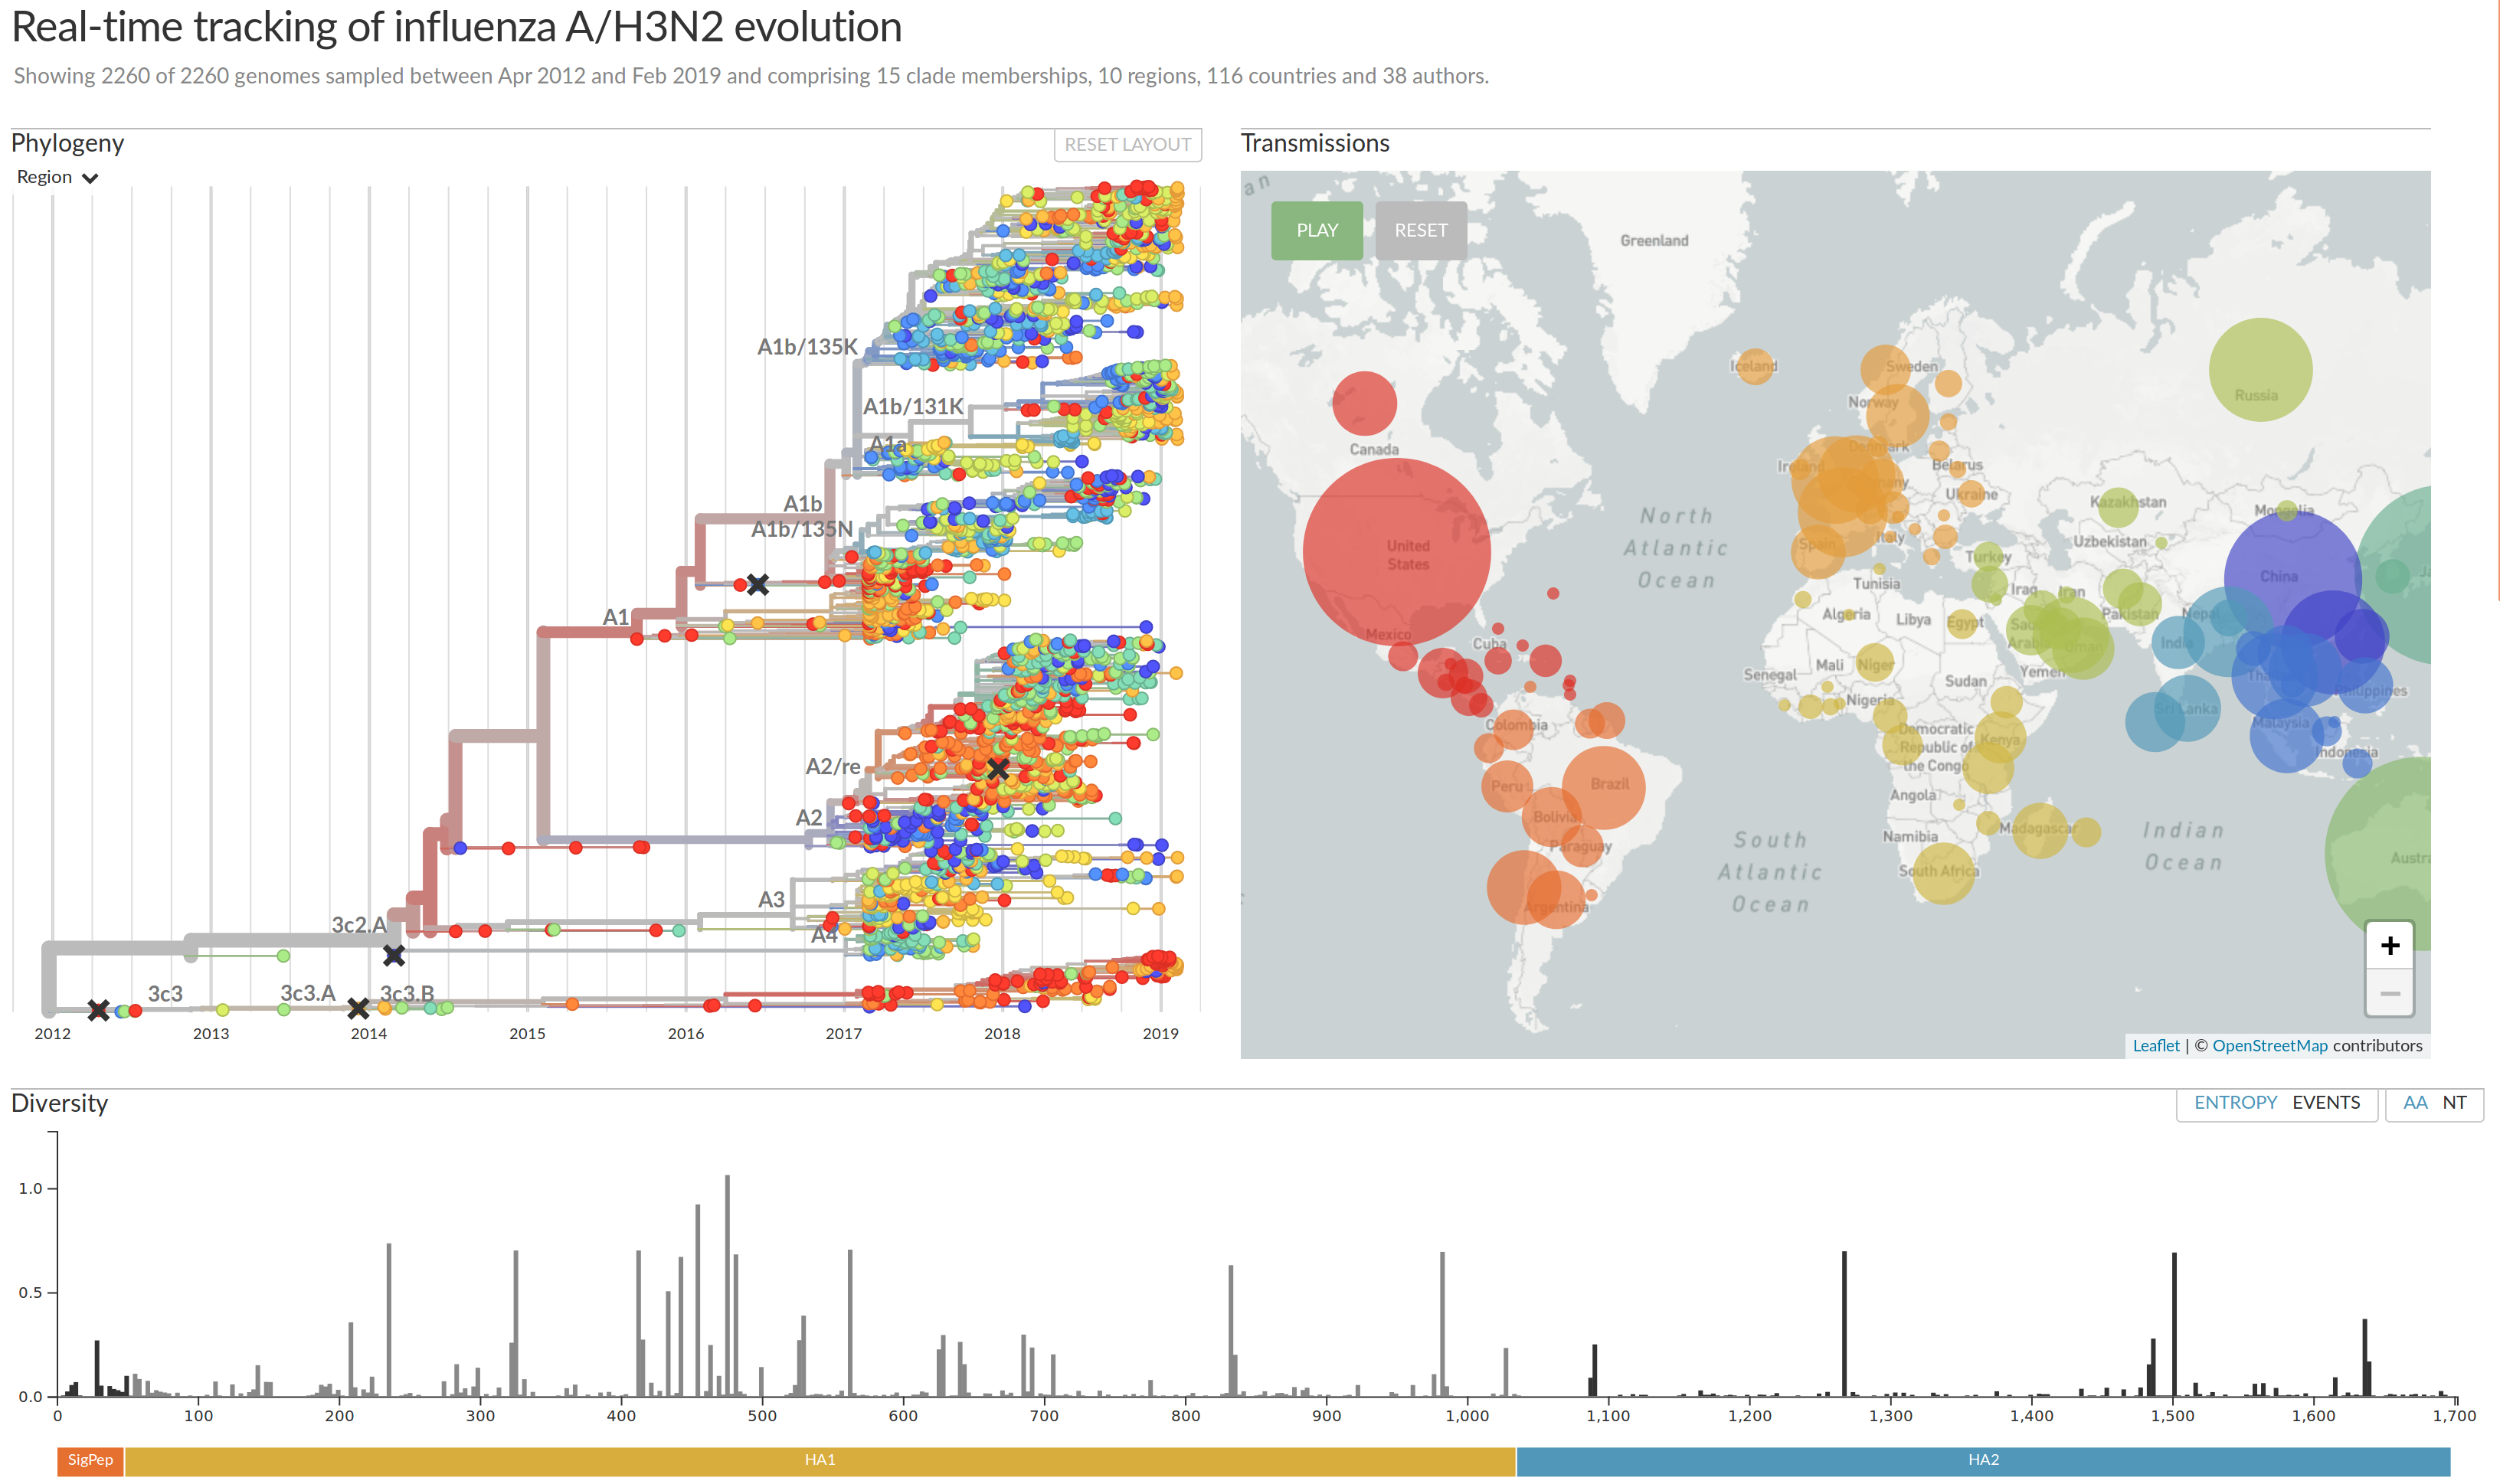
Visualization features of nextstrain
- Regular and time scaled phylogenies
- Mutations are mapped to the tree
- Filtering to time interval, region, country, authors, ...
- Zoom into clades
- Information on specific viruses
- Color by amino acid or nucleotide
- Frequency trajectories of clades and mutations
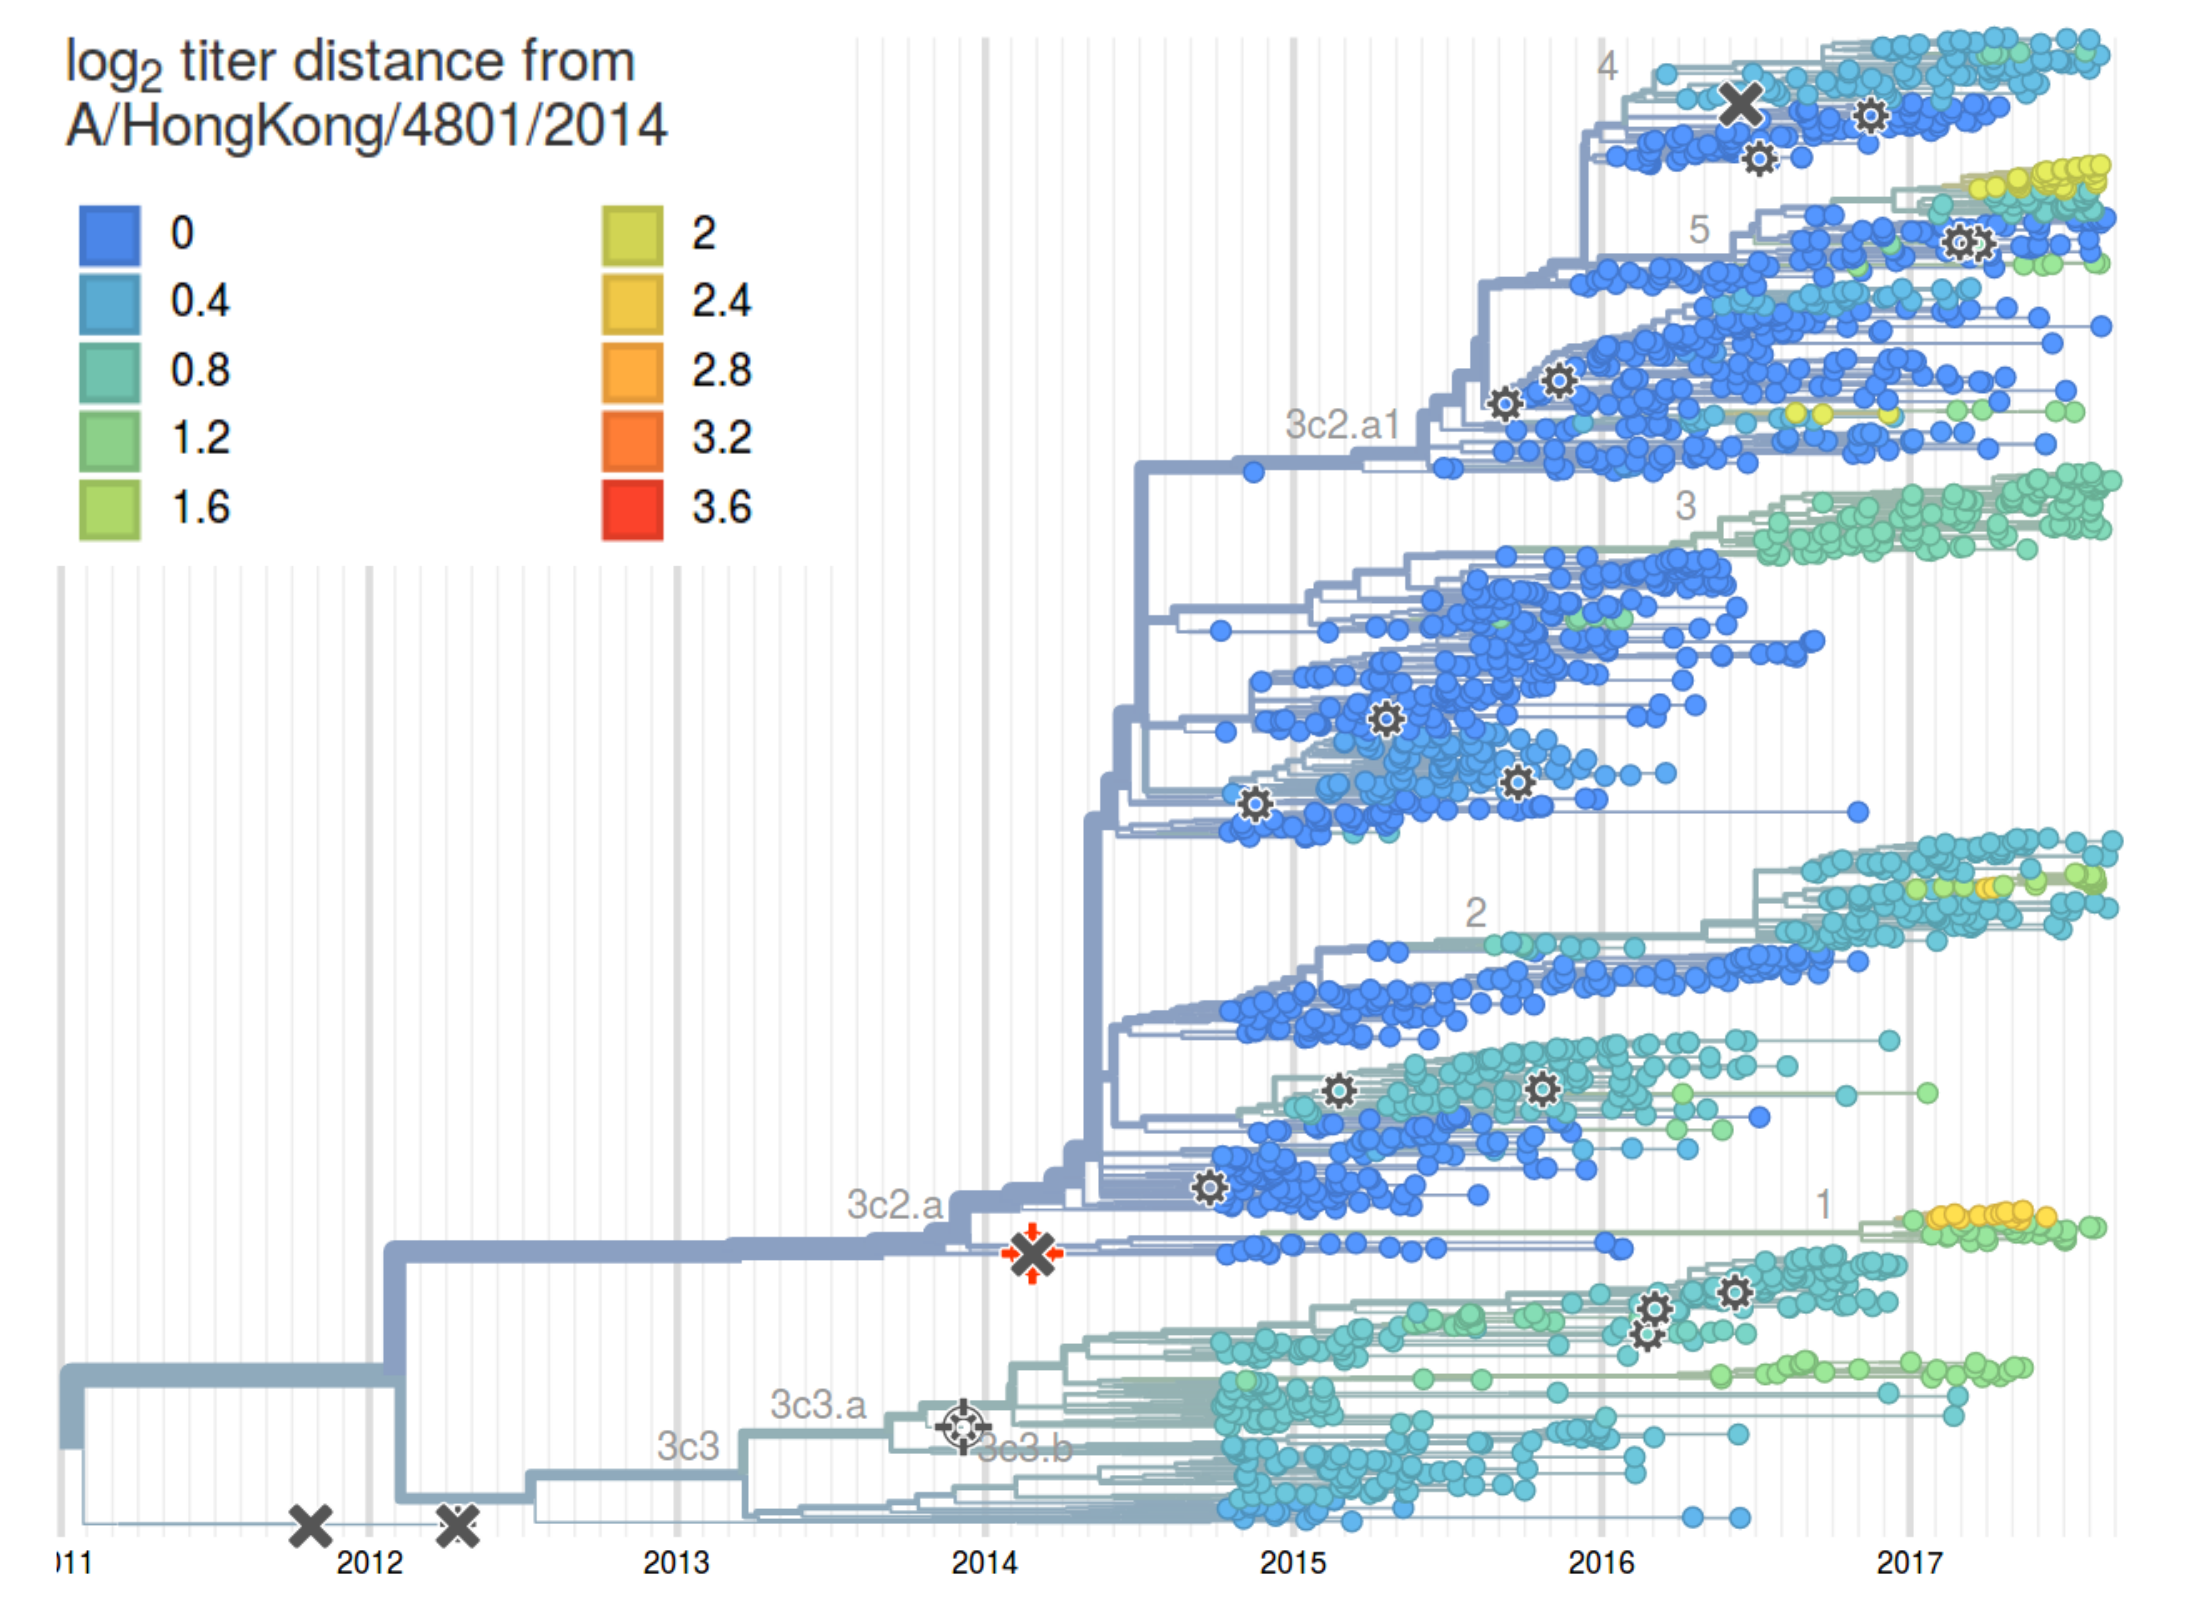
- Color by antigenic advance, predictive scores, etc
Integrating antigenic and molecular evolution

- each branch contributes $d_i$ to antigenic distance
- sparse solution for $d_i$ through $l_1$ regularization

HI distances on the phylogenetic tree
Phylodynamic analysis with nextstrain
- input: metadata (csv table) + sequences
- snakemake pipeline
- filtering
- alignment
- tree building (+time scaled trees)
- ancestral state reconstruction and phylogeography
- export to visualization
- runs in minutes to 1h
Web visualization with nextstrain
- fairly easy to set-up
- can be run locally (localhost)
- or be deployed on your own servers
- work in progress:
- flexible branding
- drag and drop features
- (better docs...)
Acknowledgments


- Trevor Bedford
- Colin Megill
- Pavel Sagulenko
- Sidney Bell
- James Hadfield
- Wei Ding
- Emma Hodcroft
- Sanda Dejanic