Real-time tracking and visualization of pathogen sequence data
Richard Neher
Biozentrum & SIB, University of Basel
slides at neherlab.org/201906_MethodsAndBeer.html
Sequences record the spread of pathogens
Mutations accumulate at a rate of $10^{-5}$ per site and day!
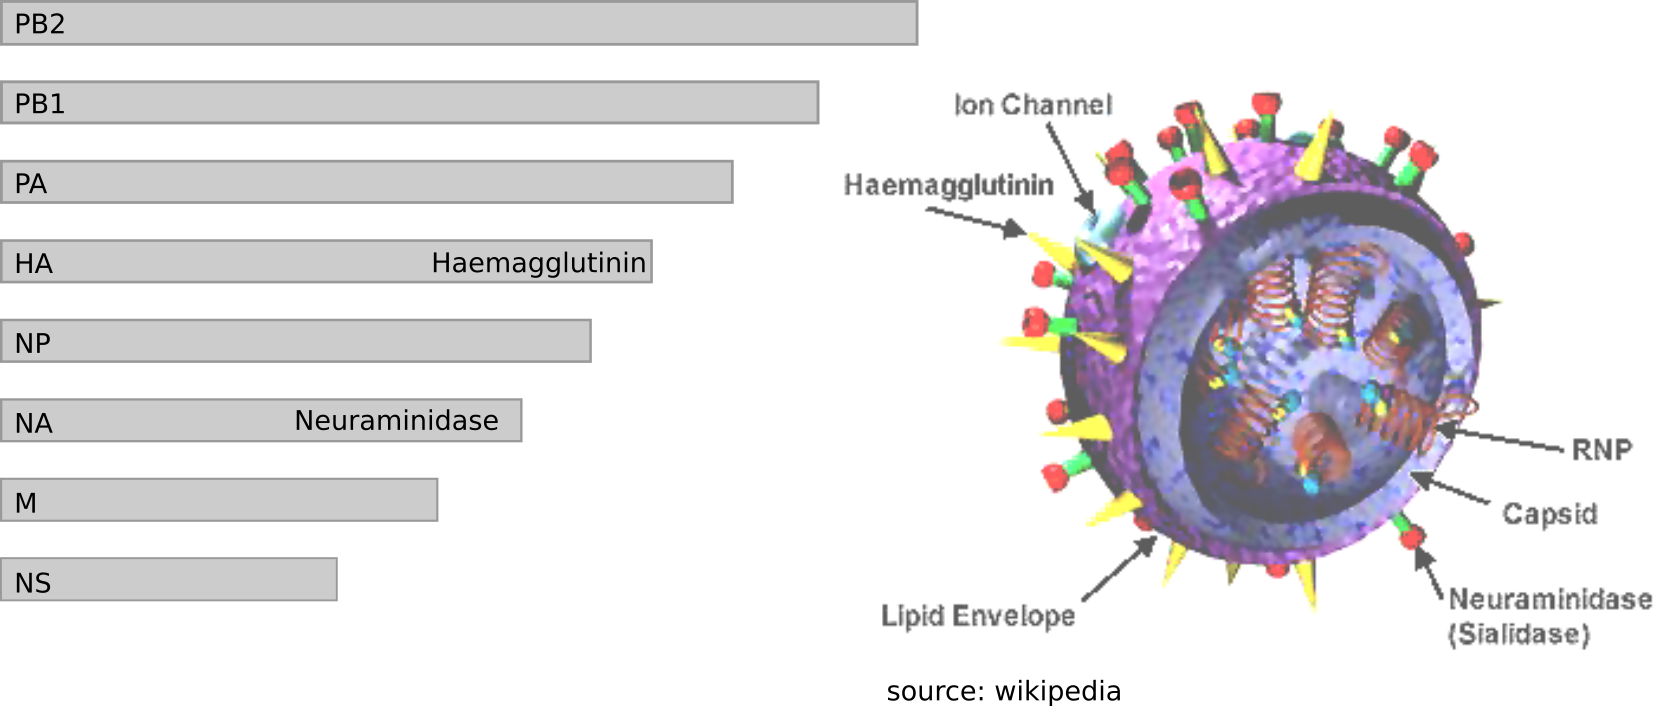
Influenza virus genome - 8 segments
Zika virus genome $\sim 10000$ bases

Ebola virus genome $\sim 20000$ bases

Many RNA viruses pick up one mutation every 2-4 weeks!
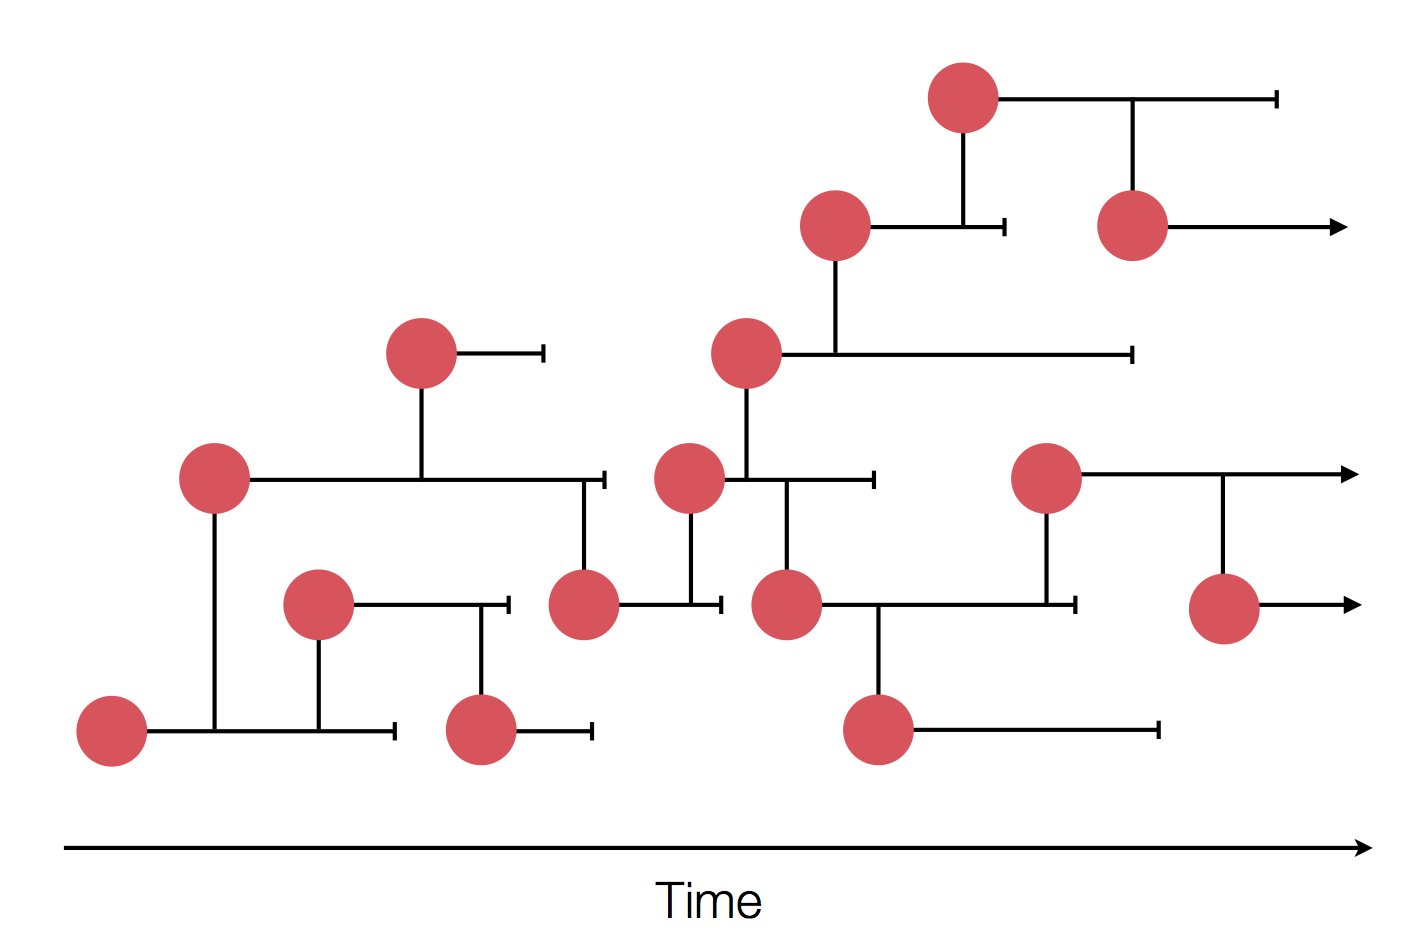
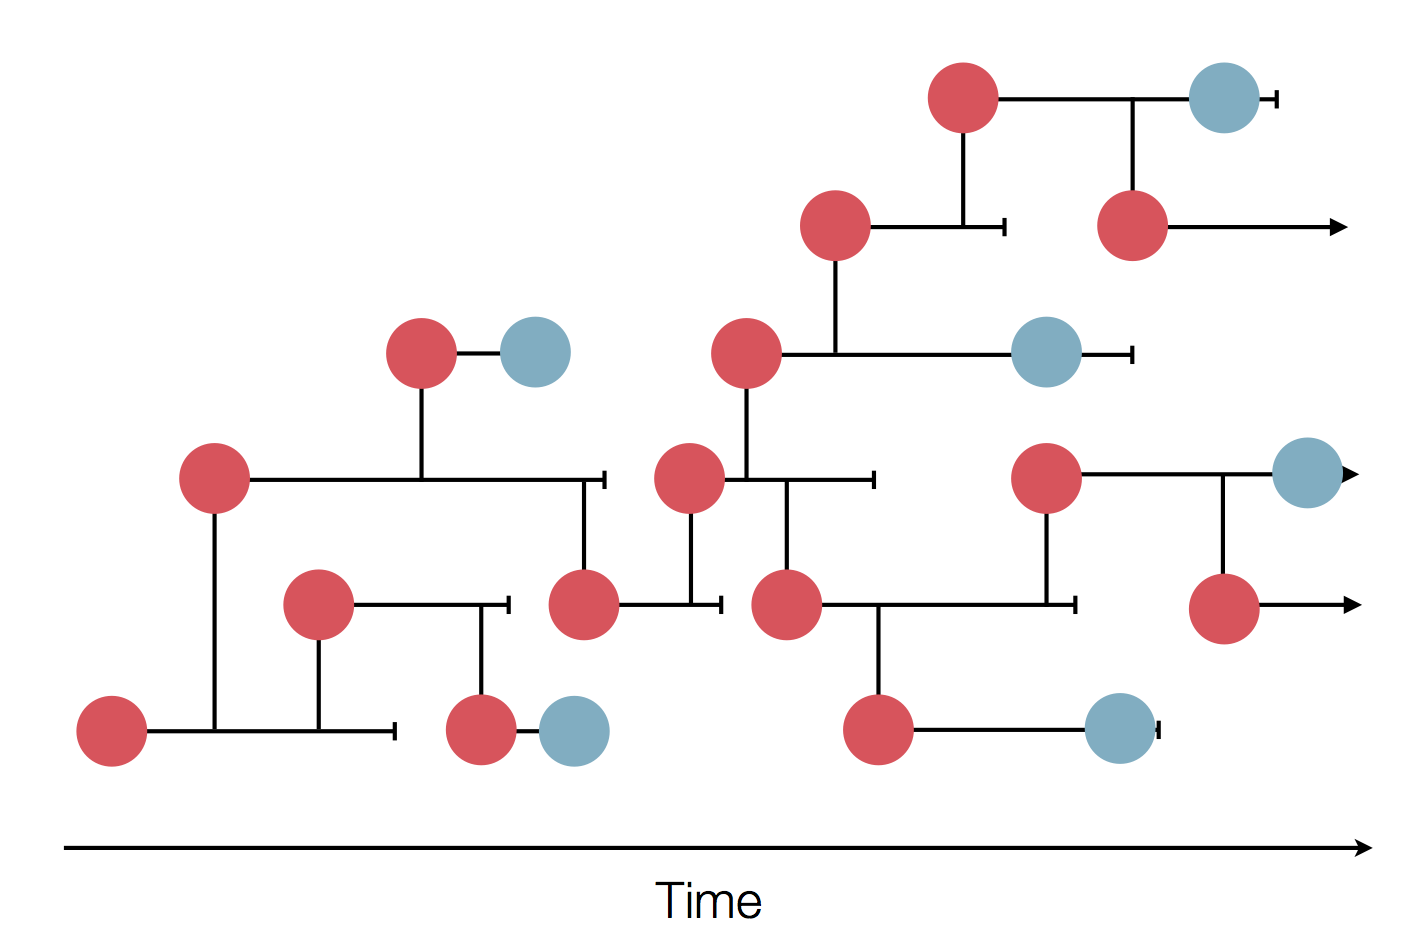
Frequent mutations imply...
- most viruses in an outbreak differ from each other
- transmission chains are can be inferred
- transmission can be ruled out!
- geographic spread can be reconstructed
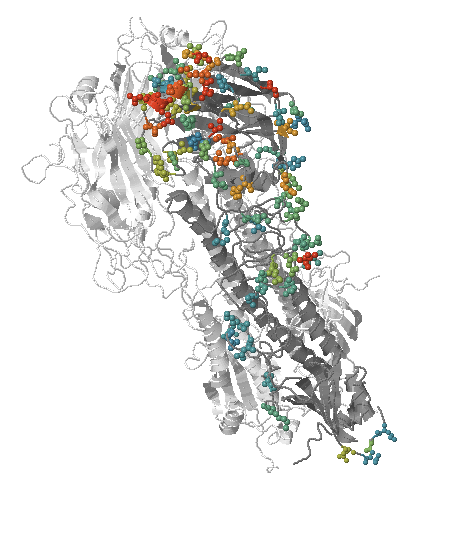
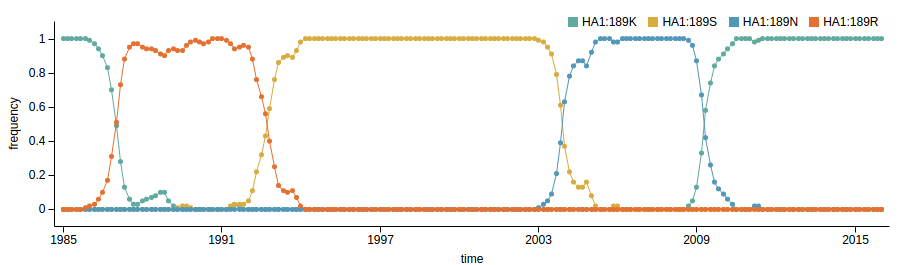
- Influenza viruses evolve to avoid human immunity
- Vaccines need frequent updates
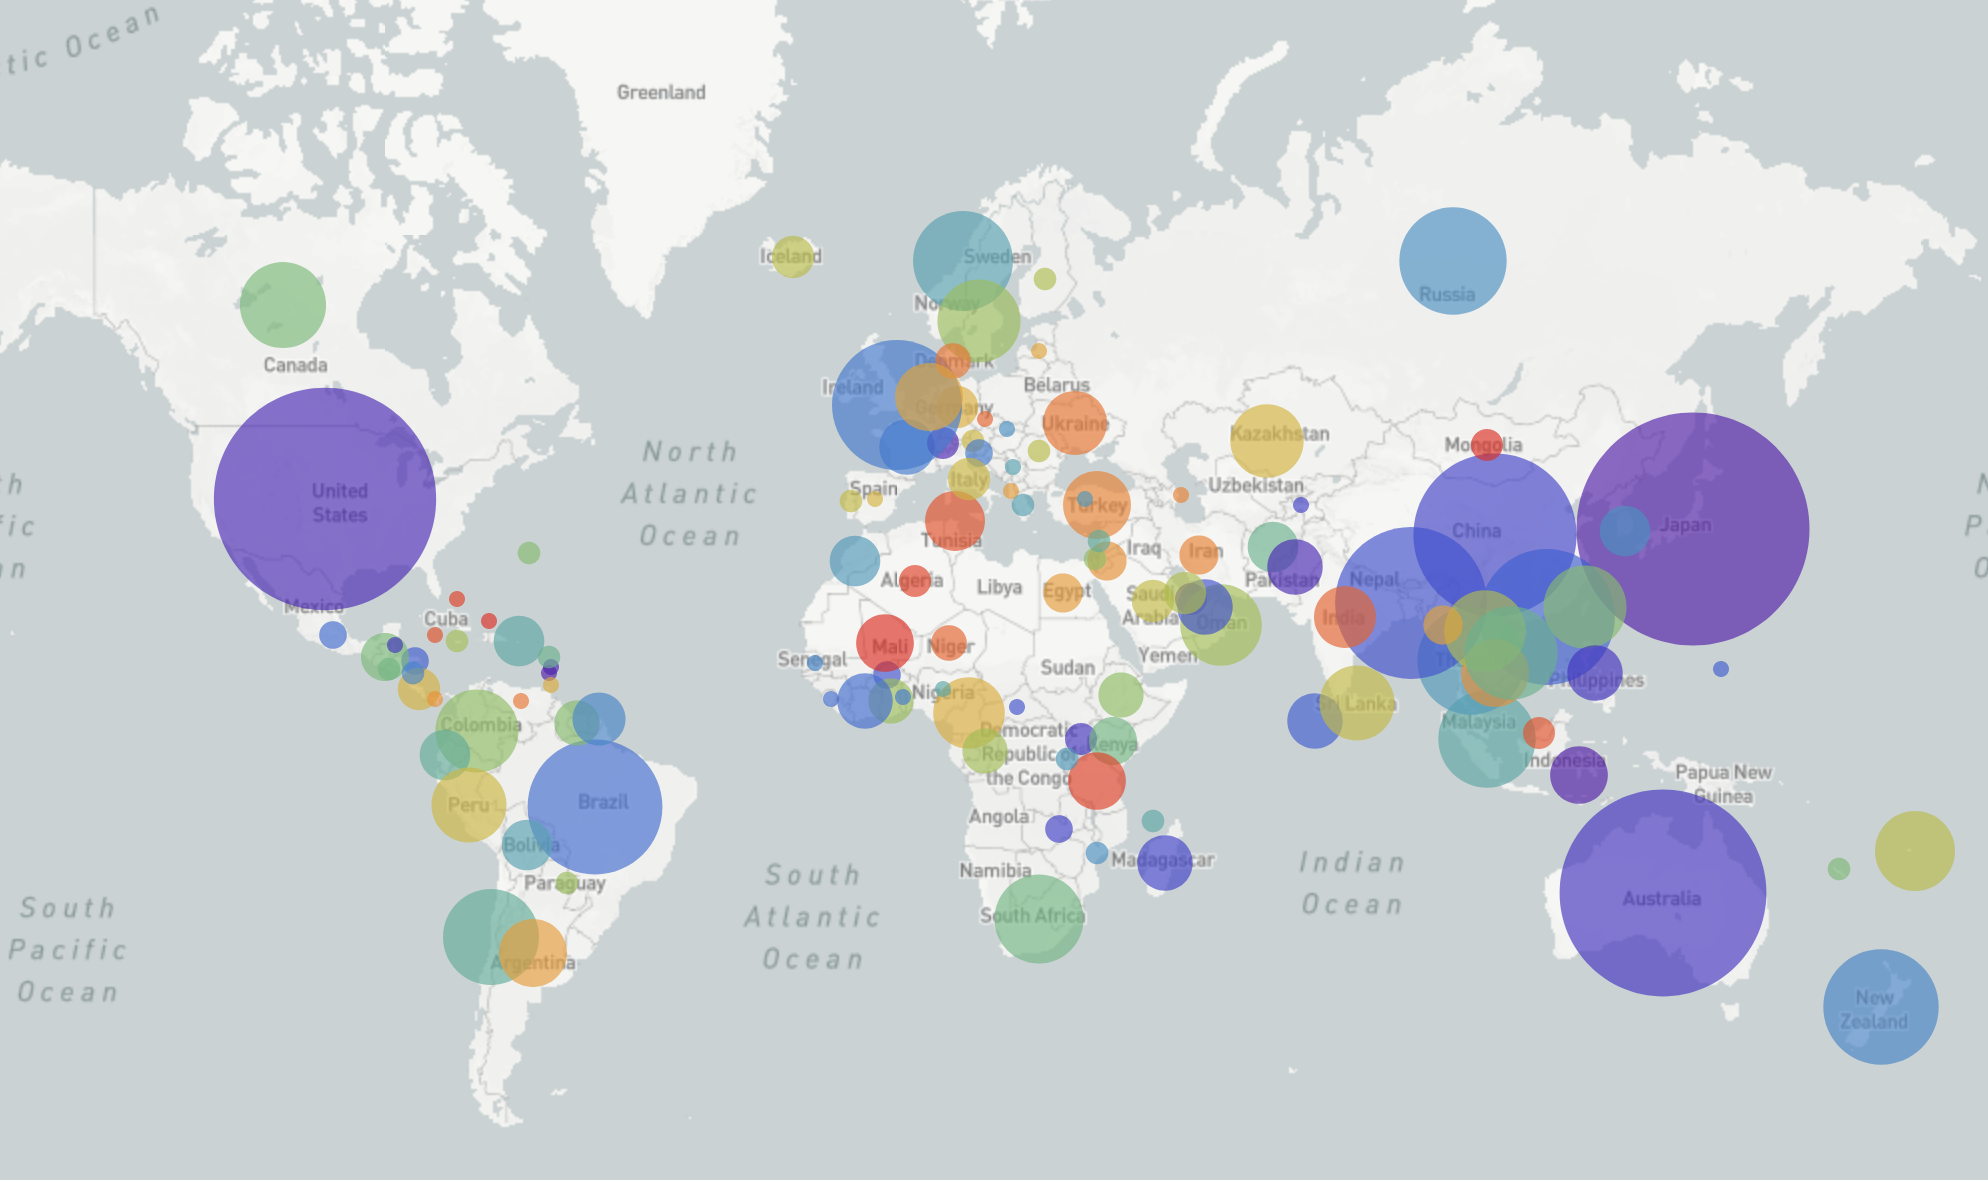
GISRS and GISAID -- Influenza virus surveillance
- comprehensive coverage of the world
- timely sharing of data -- often within 2-3 weeks of sampling
- hundreds of sequences per week (in peak months)
→ requires continuous analysis and easy dissemination
→ interpretable and intuitive visualization
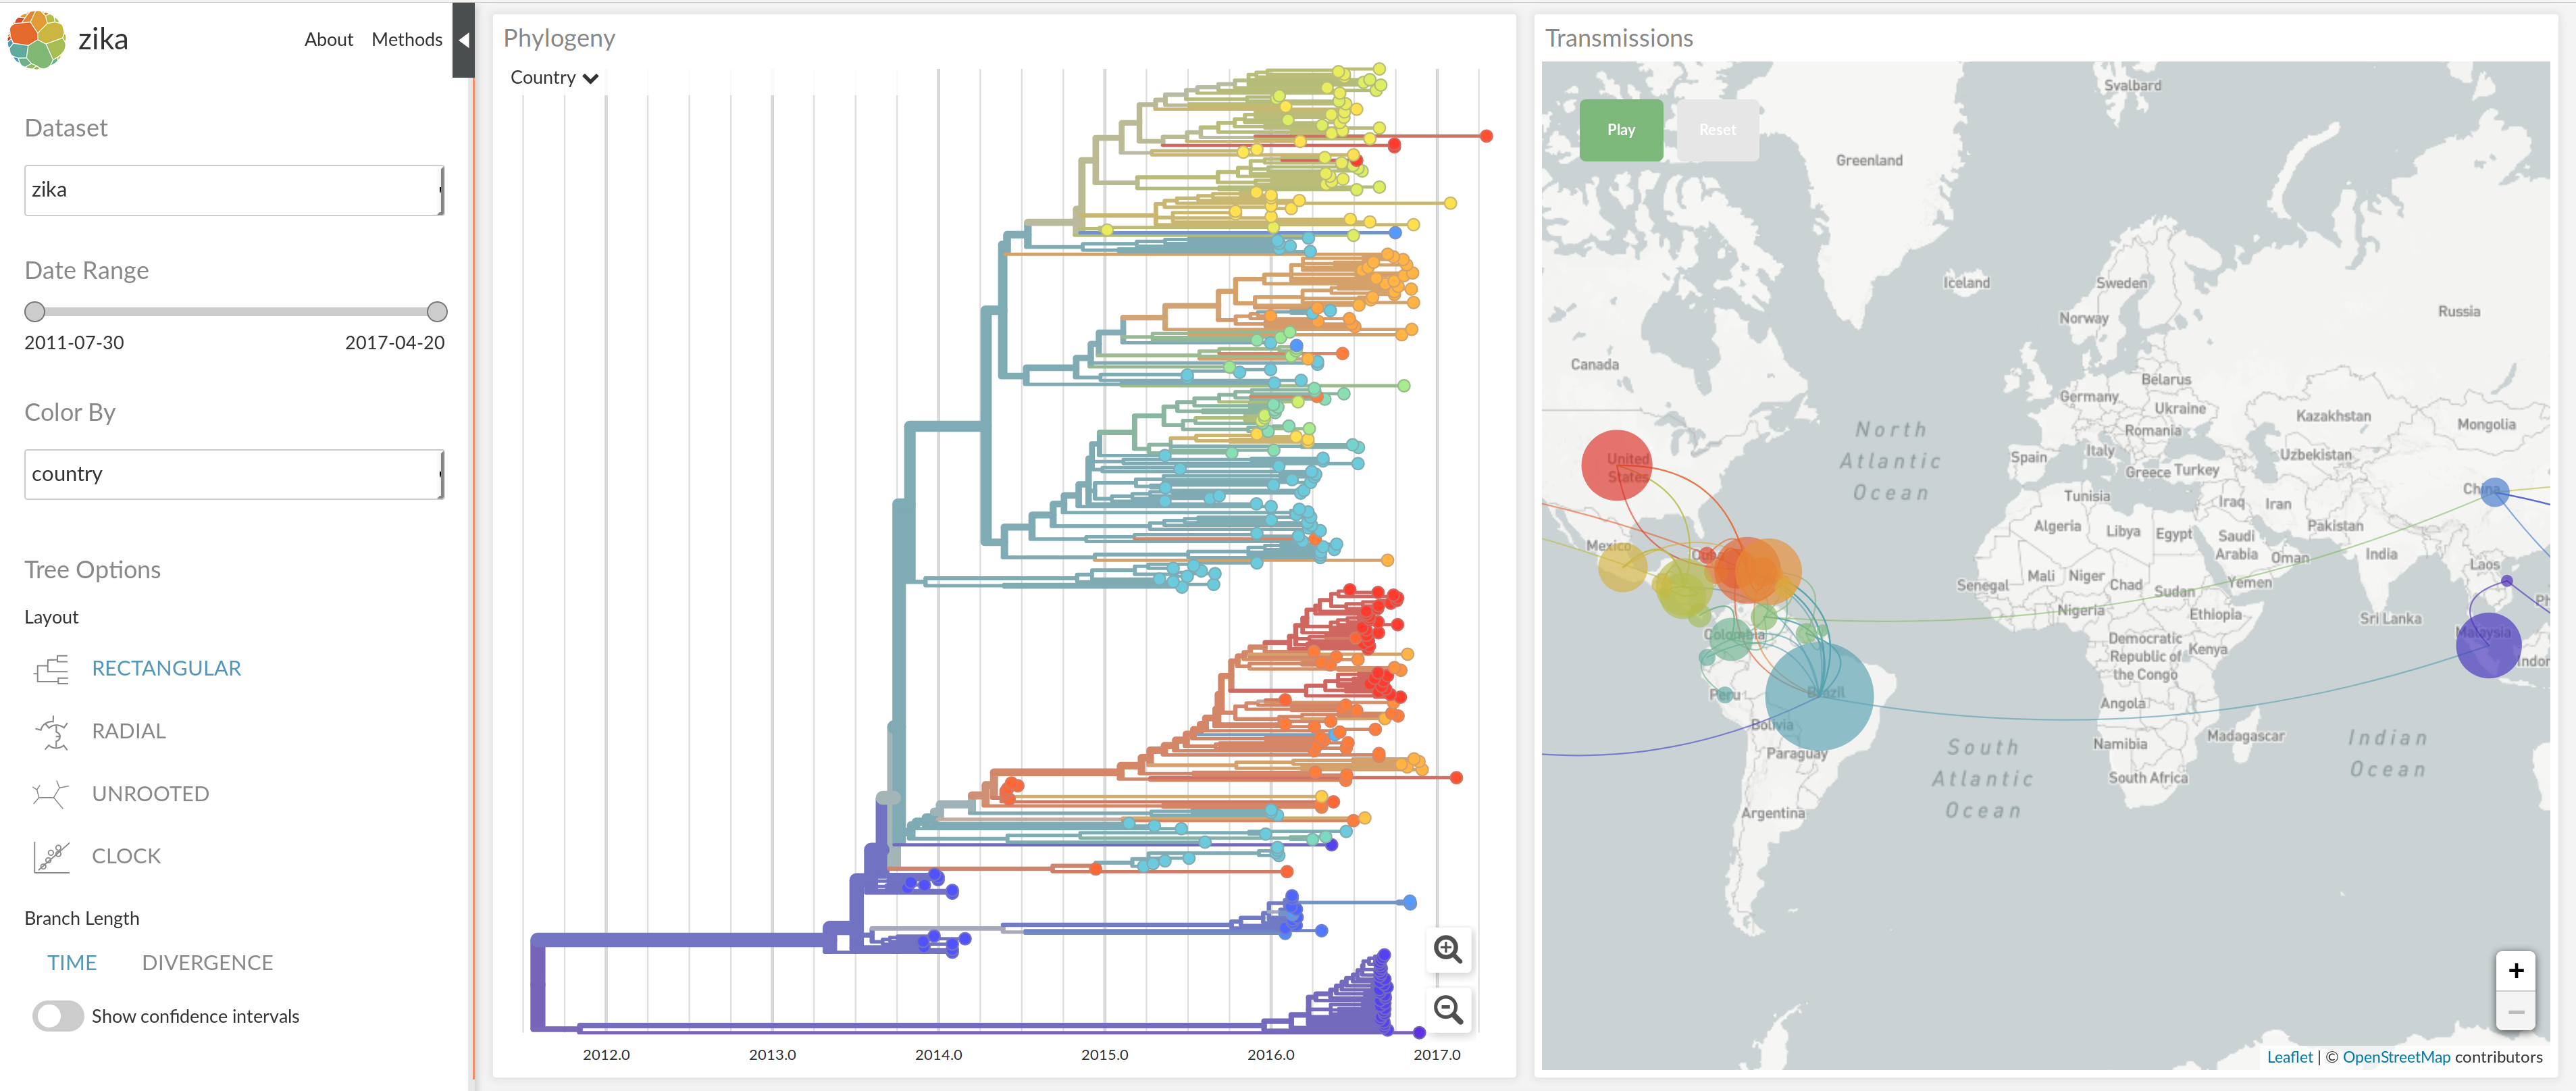
nextstrain.org
joint project with Trevor Bedford & his lab
Phylodynamic analysis with nextstrain
- input: metadata (csv table) + sequences (fasta or vcf)
- snakemake pipeline
- filtering
- alignment
- tree building (+time scaled trees)
- ancestral state reconstruction and phylogeography
- export to visualization
- runs in minutes to 1h
Web visualization with nextstrain
- can be run locally (localhost)
auspice view --datasetDir mydata - share your own builds through nextstrain/community
- deploy nextstrain on your own servers
- work in progress:
- flexible branding
- drag and drop features
- (better docs...)
Links and Tutorials
Integration of different data types is key!
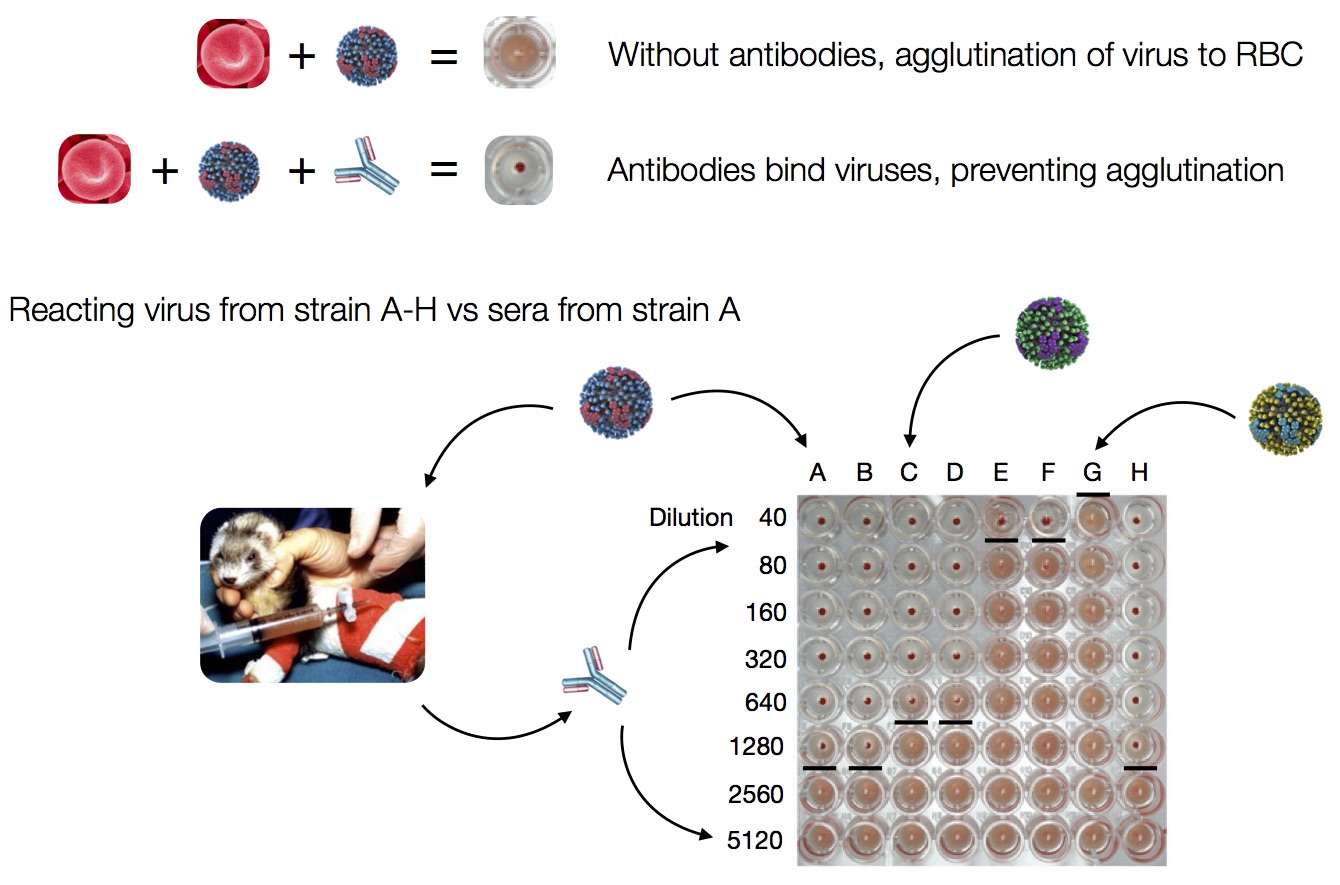
Hemagglutination Inhibition assays
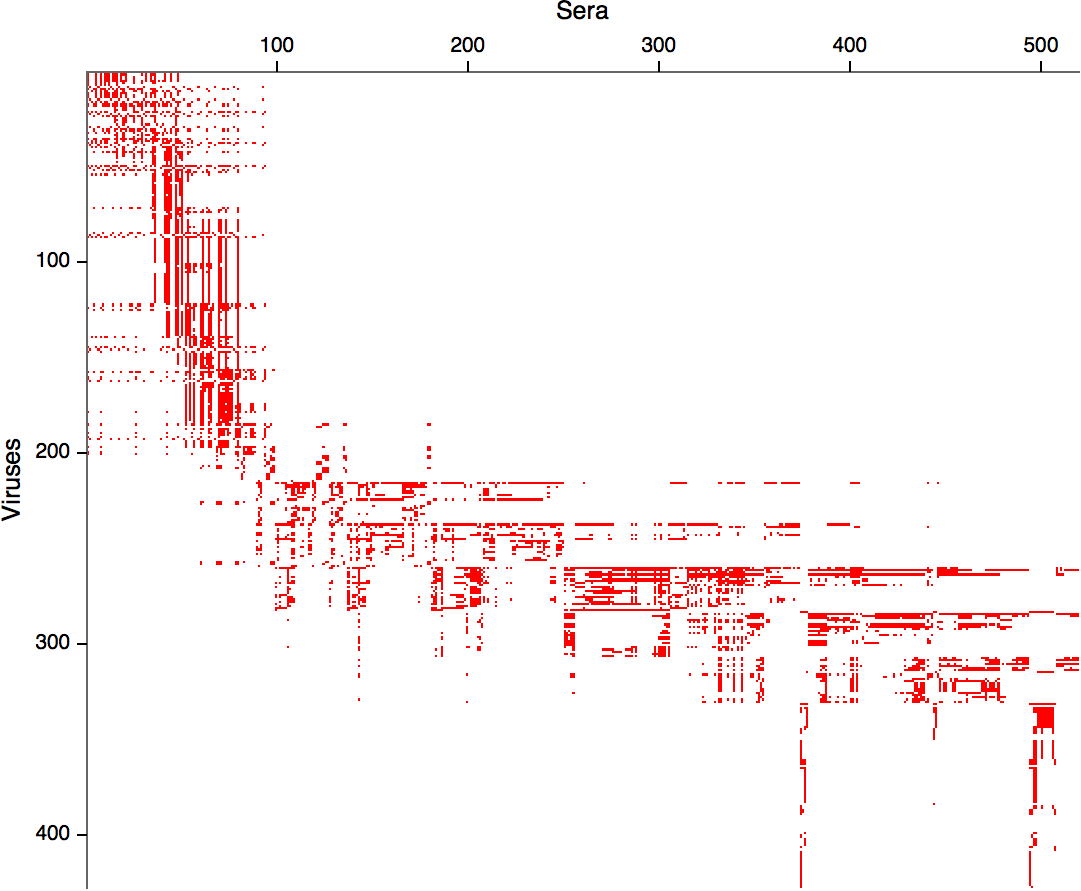
Antigenic distance tables
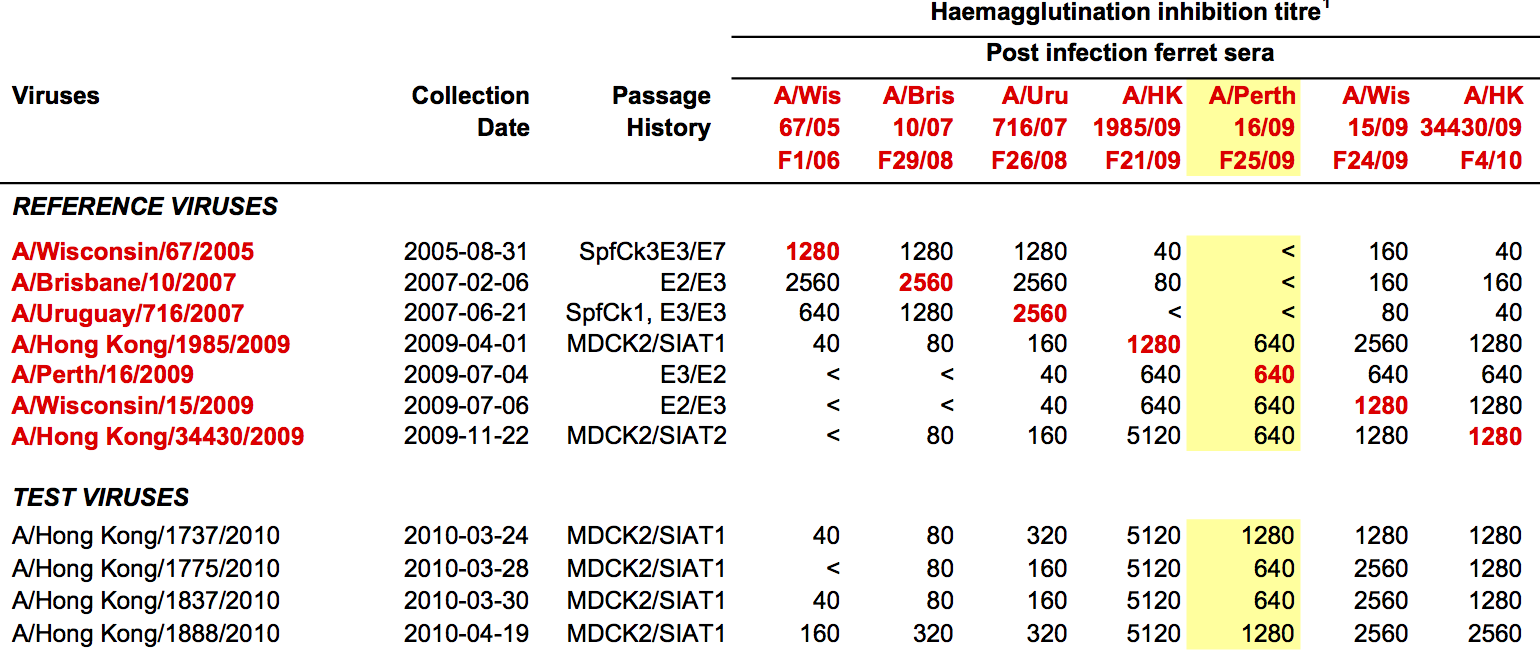
- Long list of distances between sera and viruses
- Structure of space is not immediately clear
- MDS in 2 or 3 dimensions
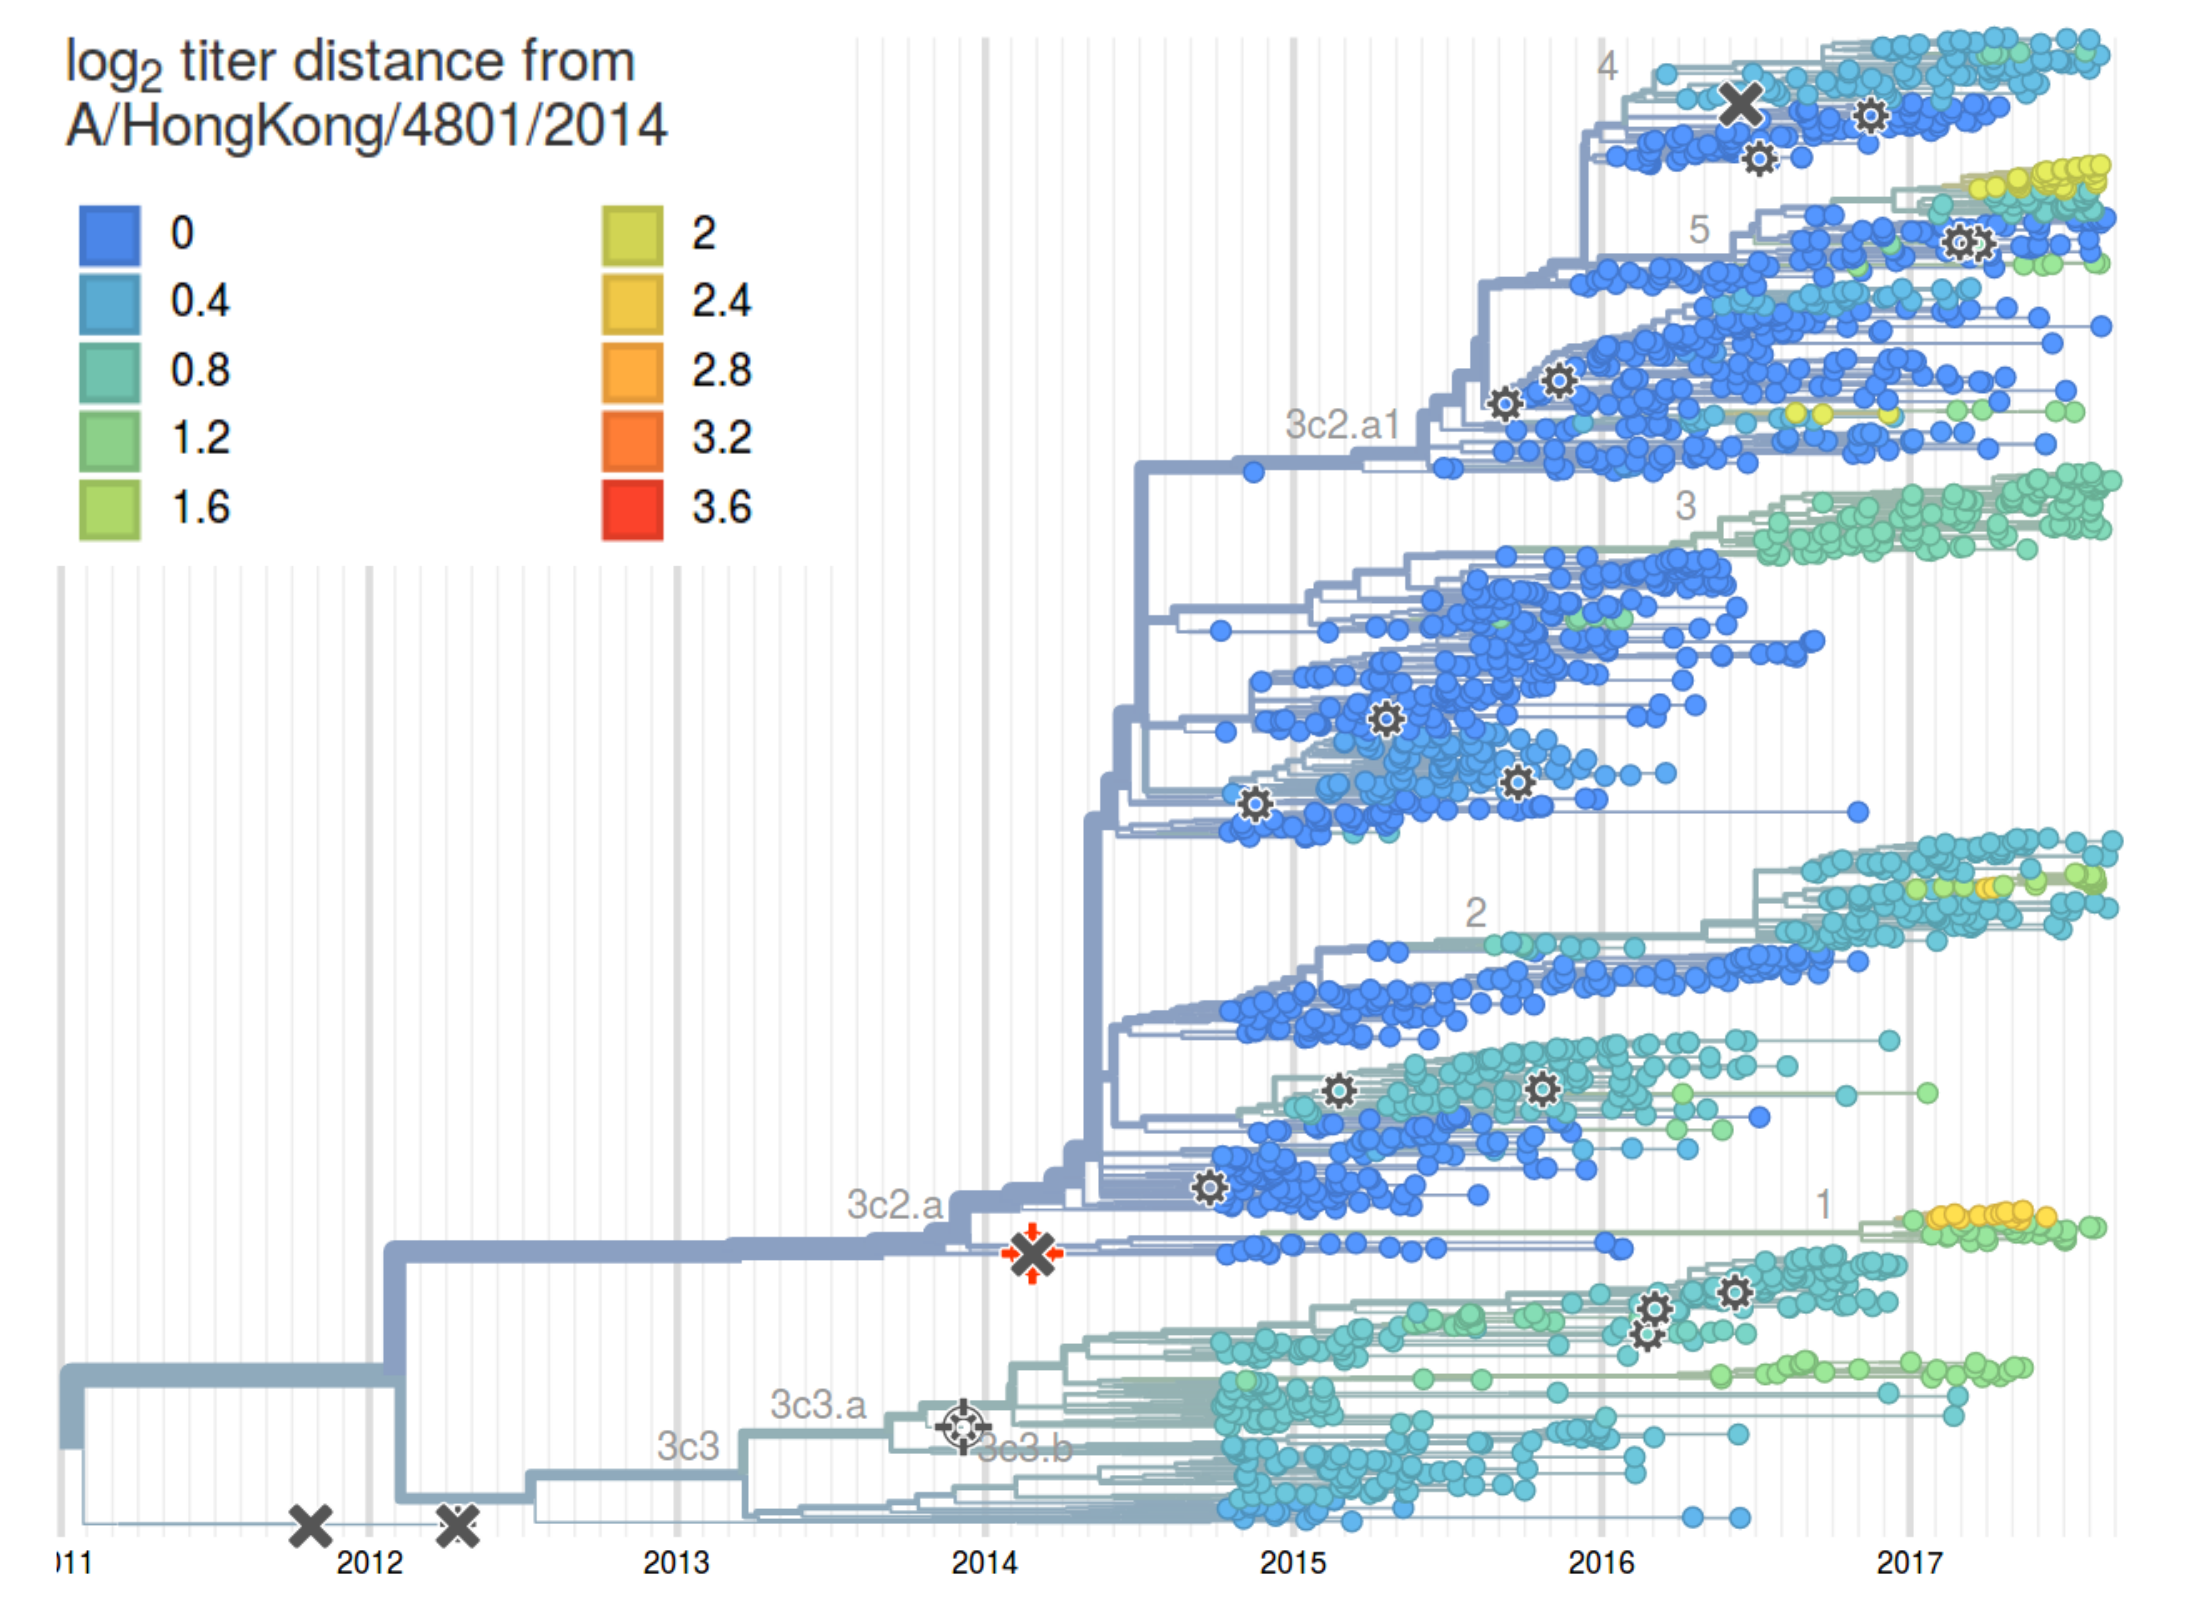
HI distances on the phylogenetic tree
Rapid analysis is crucial!
TreeTime: maximum likelihood phylodynamic analysis
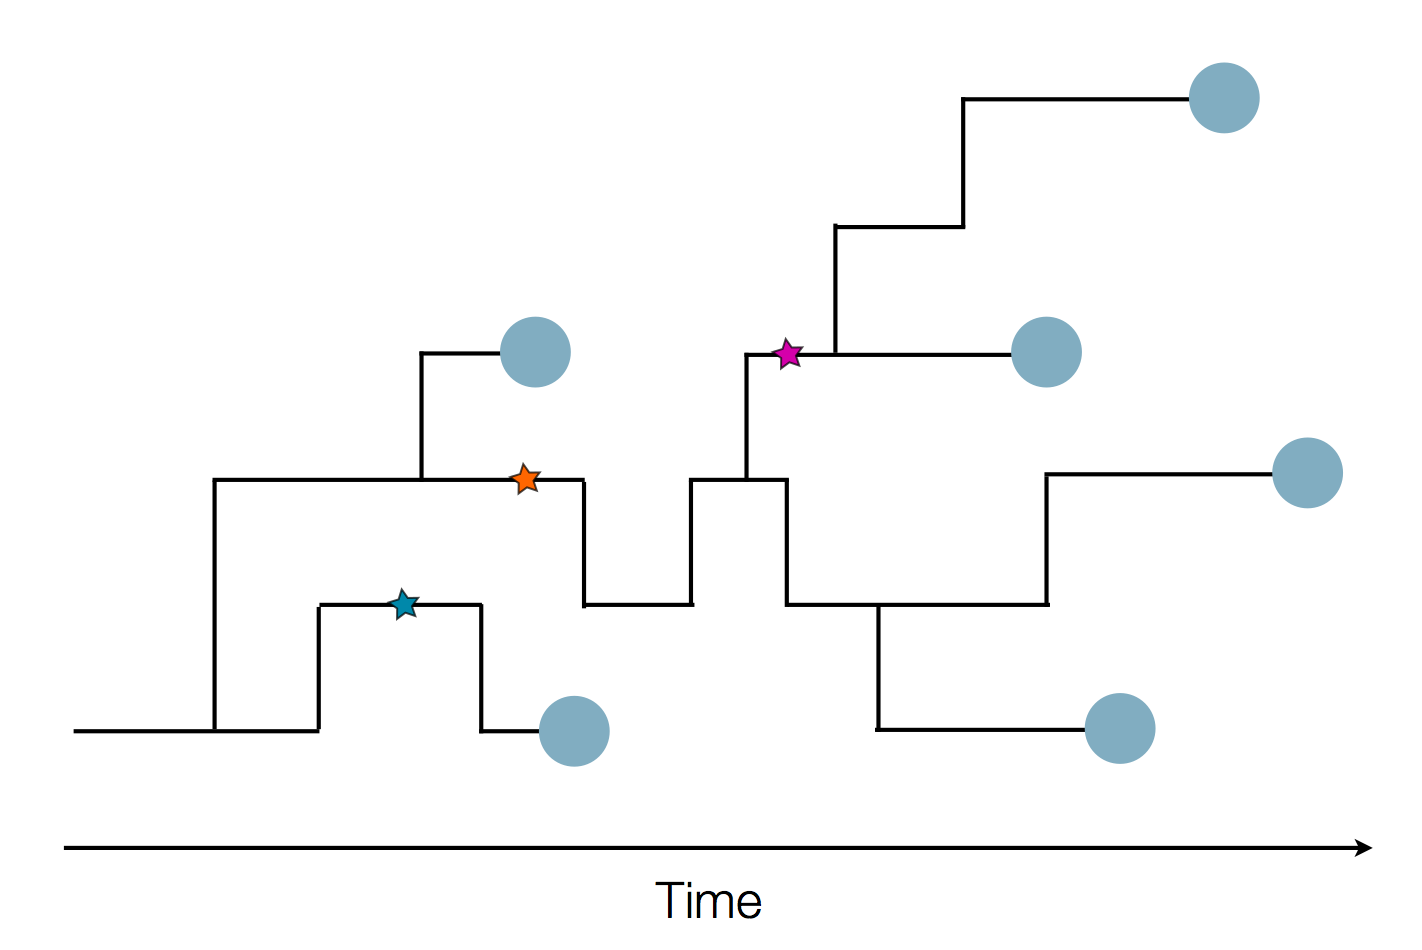
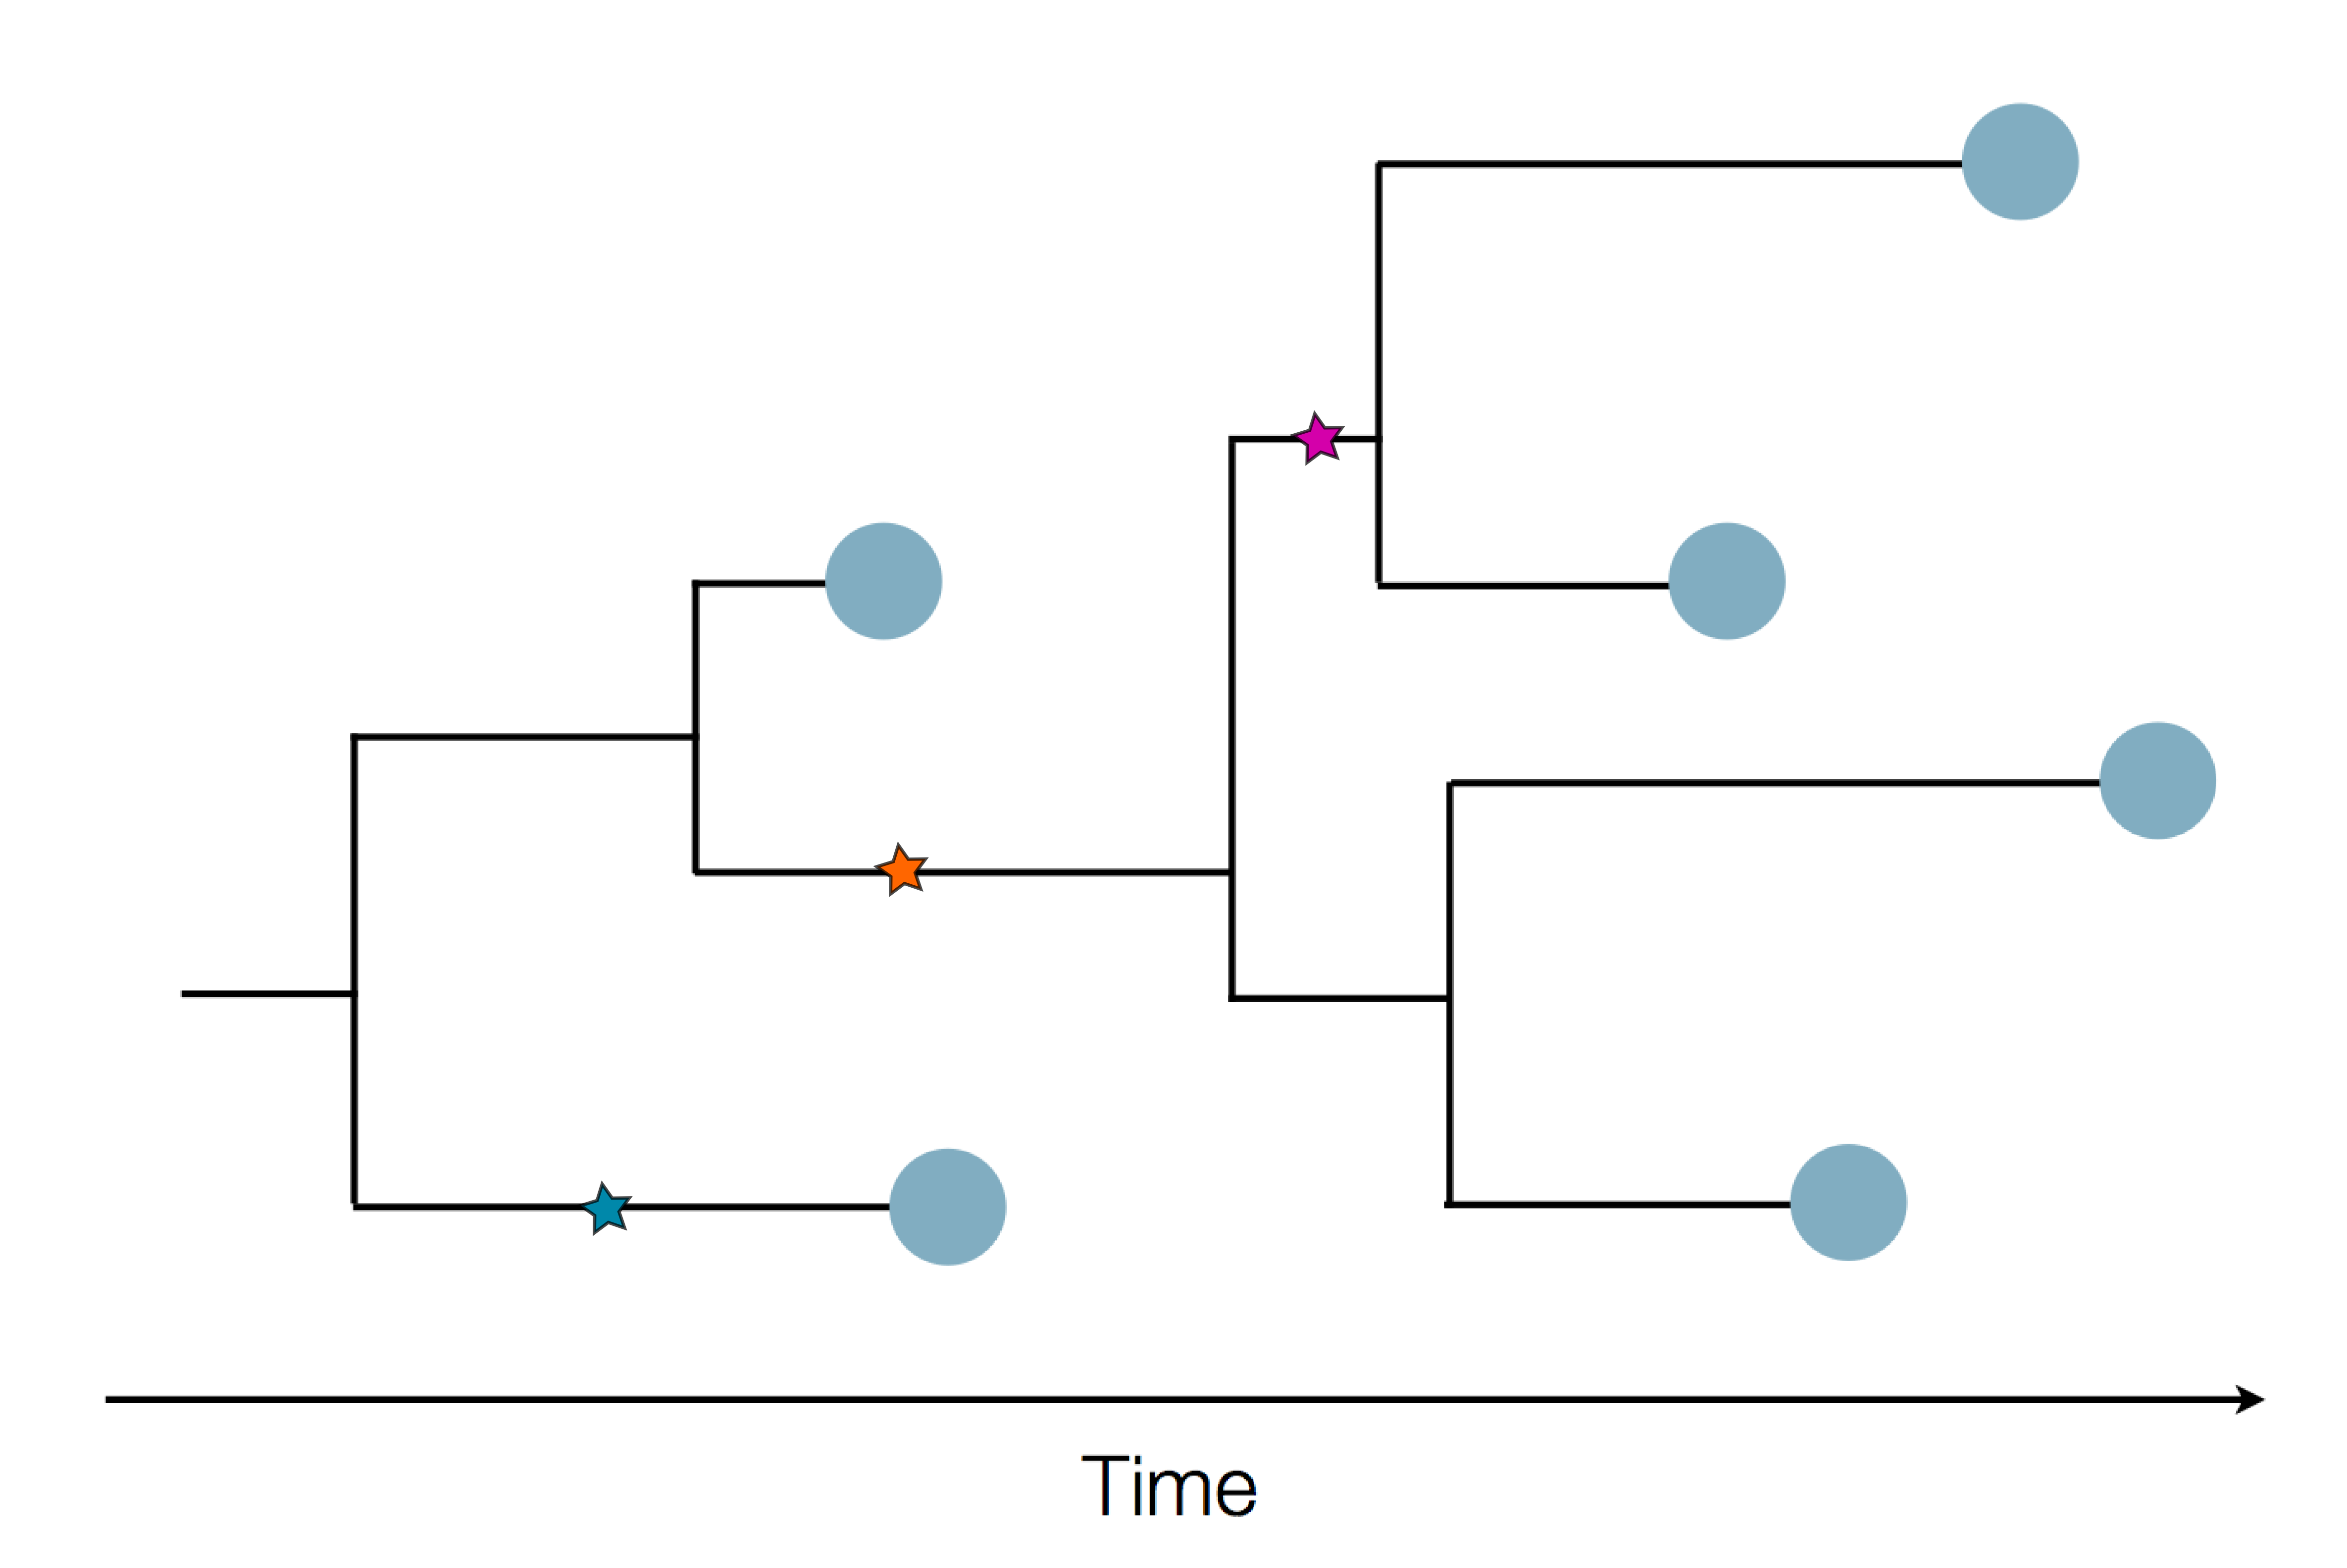
Phylogenetic trees record history:
- transmission
- divergence times
- population dynamics
- ancestral geographic distribution/migrations
Typical approach: Bayesian parameter estimation
- flexible
- probabilistic → confidence intervals etc
- but: computationally expensive
TreeTime by Pavel Sagulenko
- probabilistic treatment of divergence times
- dates trees with thousand sequences in a few minutes
- linear time complexity
- fixed tree topology
- github.com/neherlab/treetime
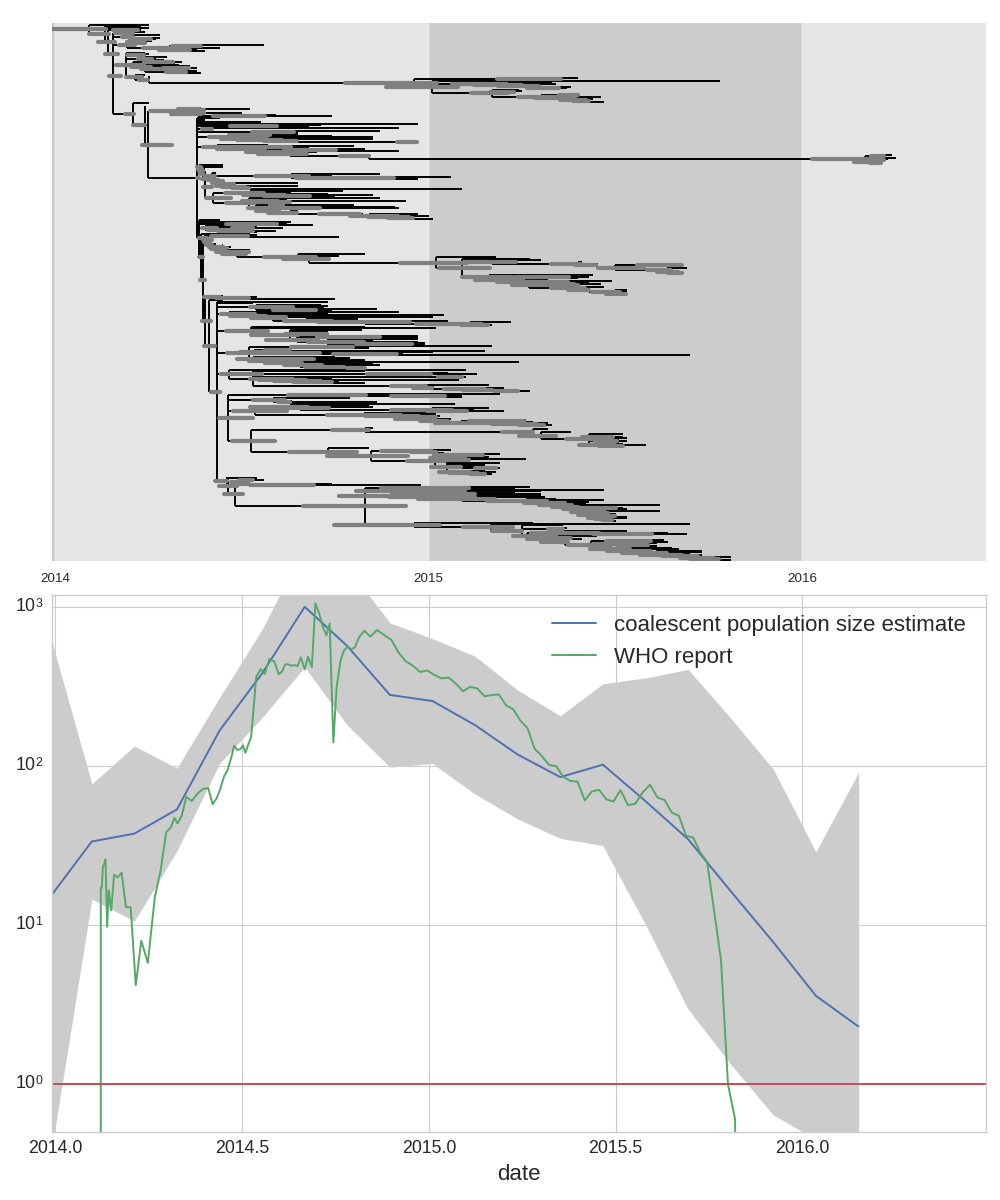
West African Ebola virus outbreak
TreeTime: nuts and bolts
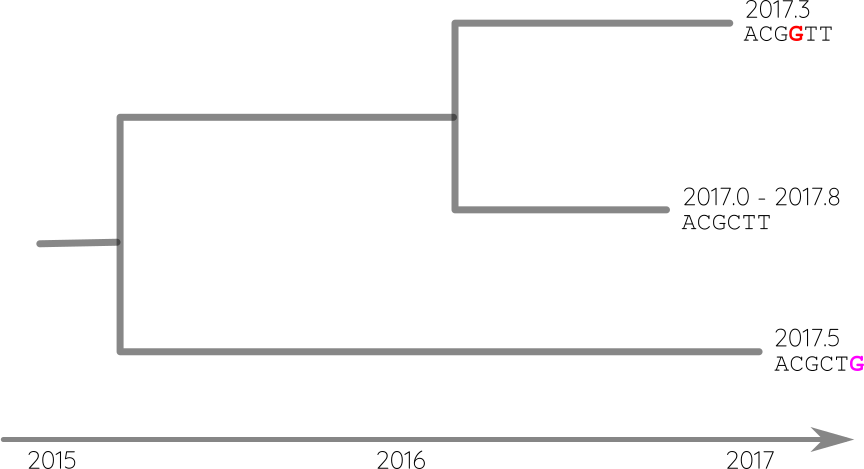
Attach sequences and dates
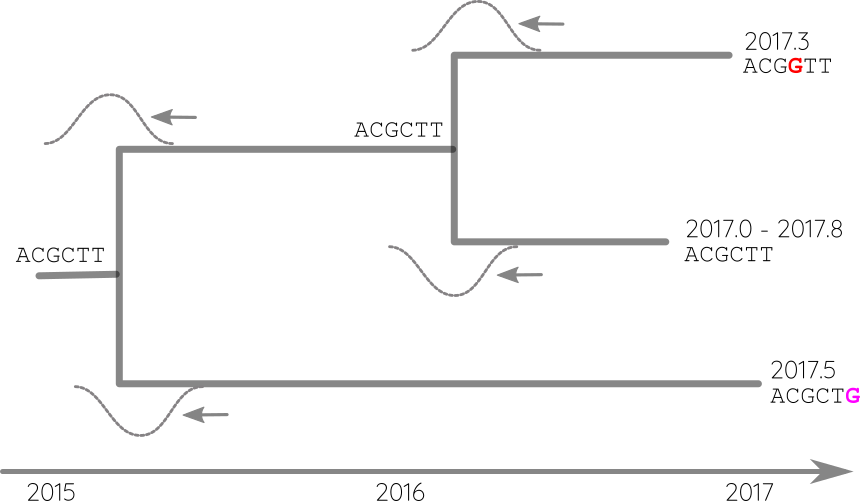
Propagate temporal constraints via convolutions
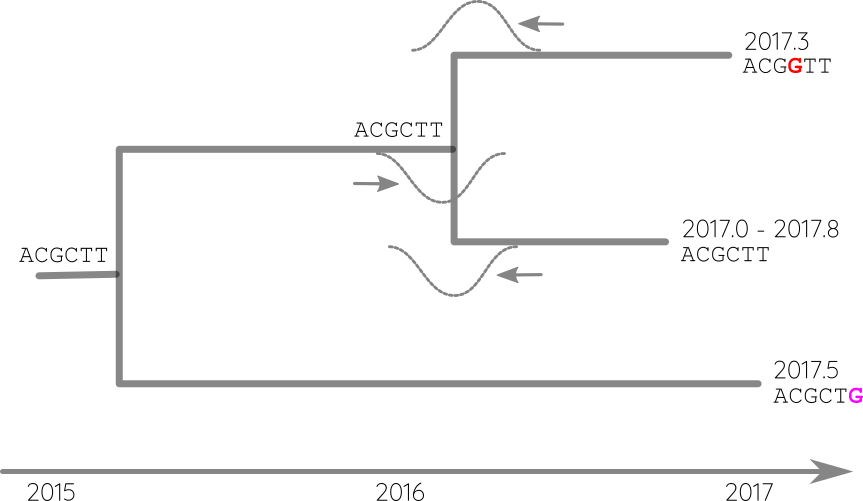
Integrate up-stream and down-stream constraints
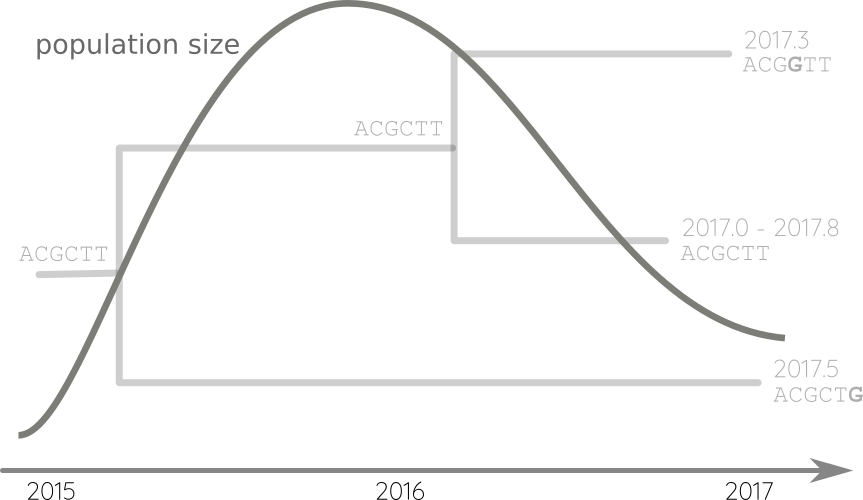
Fit phylodynamic model → iterate
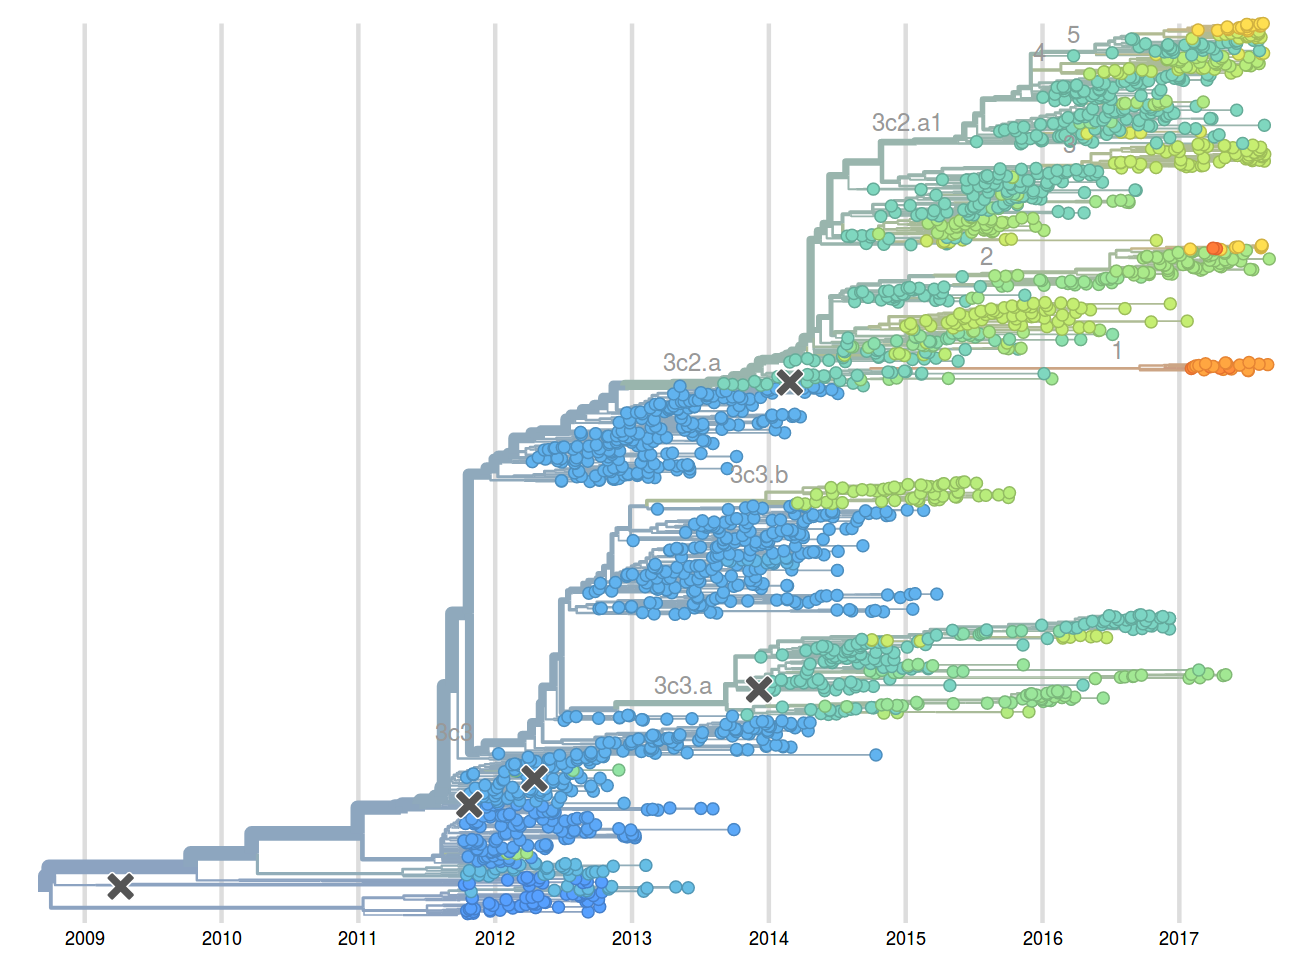
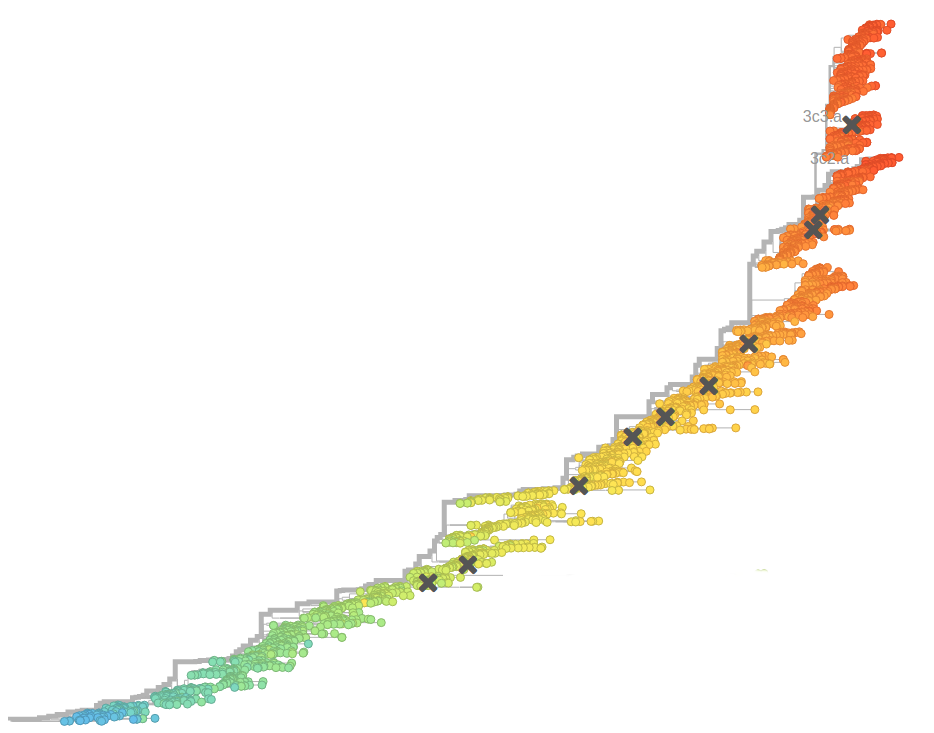
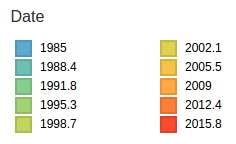
Molecular clock phylogenies of ~2000 A/H3N2 HA sequences -- a few minutes
Install Augur
- pip: `pip install nextstrain-augur` (additional dependencies IQ-Tree, mafft, vcftools)
- conda: `conda install -c bioconda augur`
Install auspice
Acknowledgments


- Trevor Bedford
- Colin Megill
- Pavel Sagulenko
- Sidney Bell
- James Hadfield
- Wei Ding
- Emma Hodcroft
- Sanda Dejanic