Influenza in temperate regions is seasonal: Only a few imported cases are observed over the summer and influenza activity is picking up around November. During winter a fraction of the population is infected by influenza viruses and builds up immunity which prevents reinfection by the same strain to a large degree. However, the viruses change their antigenic properties over time and the same subtype can reinfect previously immune individuals after some time. The rise and fall of influenza in winter depends on the rate at which the virus transmits, the fraction of the population that is susceptible at the beginning of the season, and the fraction that suffers from influenza in a given season (the attack rate). A nice recent paper on this topic is Yang, Lipsitch, Shaman. PNAS, 2015. I get a sense of how the different aspects of the seasonal influenza dynamics fit together, I looked into data on seasonal influenza by the US CDC.
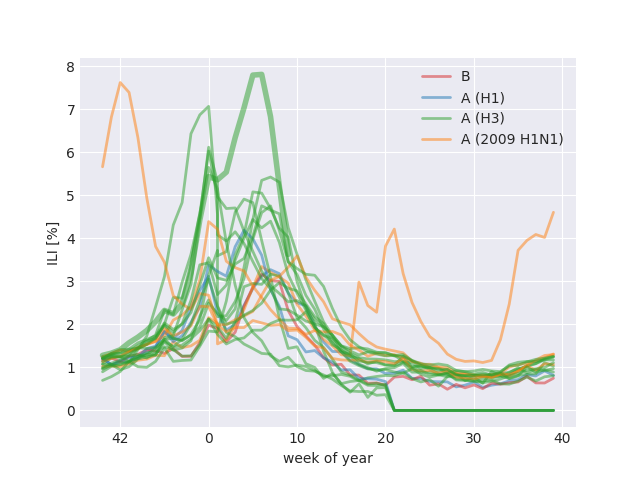
Public health authorities summarize influenza activity using a score called "Influenza Like Illness (ILI)" that quantifies the fraction of doctor visits with typical symptoms of influenza (fever, cough, sore throat). The data reported by the US CDC are shown in the figure below:

The different influenza seasons are colored by dominating subtype or lineage. ILI tends to peak shortly after the new year and A/H3N2 dominated seasons tend to result in more severe epidemics. In 2009, the pandemic A/H1N1 strain (orange) caused abnormal ILI patterns but has since then settled into a seasonal pattern. The current 2017-2018 season (highlighted by a thicker line) was worse than all previous seasons.
The seasonal pattern is believed to be due seasonal forcing coupled to antigenic evolution of the virus and subsequent loss of human immunity. Seasonal forcing refers to the fact that influenza virus transmits better in winter than in summer (the underlying causes are still unclear, relative humidity is a plausible driver in temperate regions). The other aspect that determines the dynamics of transmission is antigenic evolution and loss of immunity. In absence of influenza activity, the fraction of individuals that are susceptible to influenza infection grows since viruses change an immunity is lost. In contrast, the susceptible fraction shrinks when influenza activity is high since infected individuals will build up immunity against the circulating influenza strain.
The purpose of this note is to go through elementary numbers that determine the rate at which influenza viruses spread, the fraction of the population they infect in a given season, and the fraction of individuals that are susceptible. The assumptions made below are quite drastic and the relationships we establish should be taken as qualitative rather than quantitative.
To a first approximation, the growth rate \(\beta\) of influenza epidemic can be estimated from the number of reported cases \(x(t)\) at time \(t\) and at a later time \(t+D\): $$ D\beta = \frac{x(t+D) - x(t)}{x(t)} = R_0 \alpha - 1 $$ Here \(D\) is the time between subsequent infections in a transmission chain, \(R_0\) is average number of subsequent infections in a population that is 100% susceptible and \(\alpha\) is the actual fraction of susceptible individuals. The product \(R_0 \alpha\) is sometimes referred to as effective \(R_e\)). At steady state, the growth rate needs to vanish and we expect \(\alpha = R_0^{-1}\). Influenza, however, is not at steady state. At the beginning of the season, the growth rate of the dominant strain positive and drops below zero as the end of the season approaches. During that time \(\alpha\) dropped by \(\Delta \alpha \) such that $$ D\beta = R_0 \alpha - 1 > 0 > R_0 (\alpha - \Delta \alpha)- 1 $$
Measuring the growth rate \(\beta\) of influenza
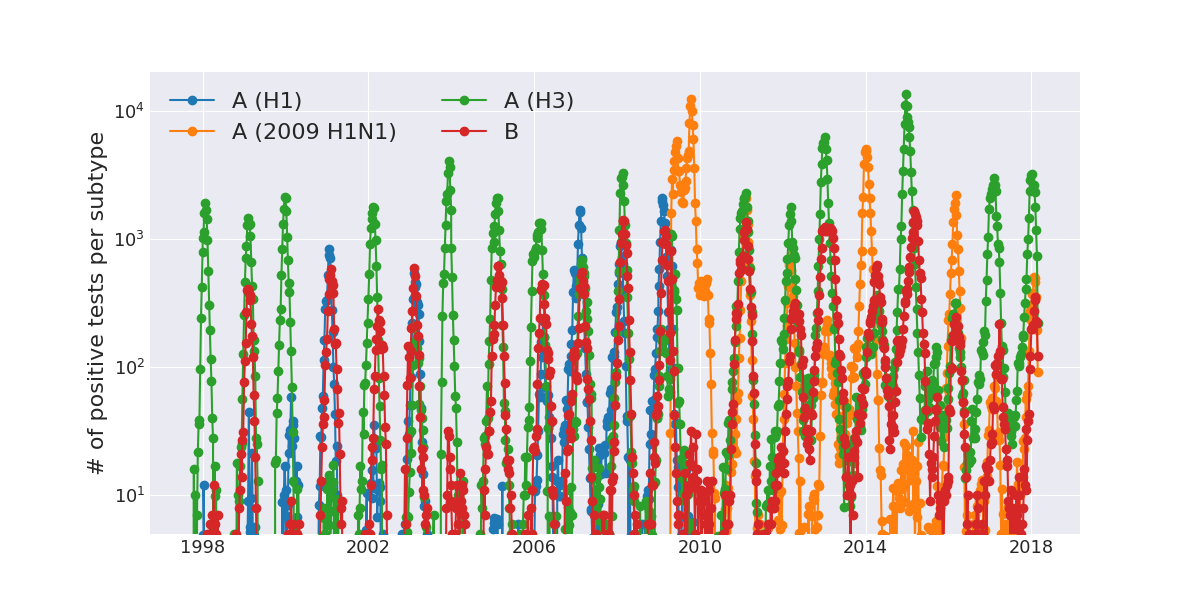
In addition to the ILI score, public health laboratories report the number of positive influenza tests for each week of the year. These tests typically differentiate influenza A and B viruses as well as the different subtypes of influenza A (H1N1, H3N2, and 2009 H1N1pdm). At the peak of the influenza season, there are thousands of positive tests per week. Despite various problems of biases in health care seeking behavior and the volume of samples that are tested, these numbers give us a good sense of how rapidly the seasonal influenza epidemics take off.

This graph shows the number of positive tests for the different influenza virus types (B, A/H1, A/H3, A/H1pdm 2009) through time. Again, the dominance of A/H3 in most years and the anomalous dynamics in 2009 due to the pandemic H1N1 variant is apparent.
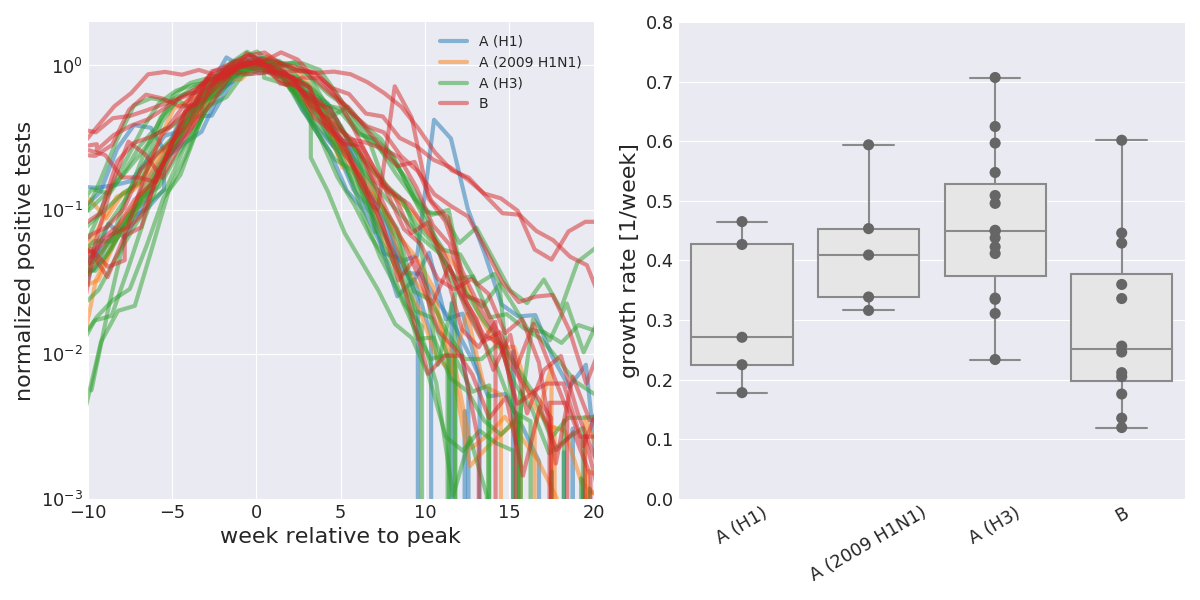
For each season, we can estimate the rate \(\beta\) at which the influenza spreads for each subtype that has substantial circulation. The plot below shows on the left the number of positive tests for each season and subtype aligned at the peak. Note the logarithmic \(y\)-axis. The right panel shows simple estimates of the growth rate for each subtype and season.

A/H3N2 tends to have growth rates around 0.4/week, while the other subtypes have lower growth rates arount 0.2-0.3/week. Furthermore, the different seasons and subtypes align pretty well with a typical standard deviation of 3-5 weeks. Furthermore, the decline after the peak has a similar slope as the rise before the peak. The infectious period or the typical time between infections is somewhat short of a week and most estimates but it to \(4-5\) days or 0.6-0.7 weeks. Our growth rate estimates hence corresponds to \(R_0\alpha = 1 + \beta D \approx 1.3\) for A/H3N2 and \(R_0\alpha\approx 1.2\) for the other types. After the season, our analysis suggest that \(R_0(\alpha-\Delta \alpha) \approx 0.7 \). Hence we can deduce that \(R_0 \Delta \alpha \approx 0.6 \), which as one immediate consequence: $$ \frac{\Delta\alpha}{\alpha} \approx \frac{0.6}{1.3} \approx 0.45 \quad \mathrm{for \ A/H3N2} $$ This implies that about 45% of susceptible individuals are infected in a given season. For other lineages, this works out to slightly smaller number, but still essentially 40%. Of course, our argument is extremely symplistic and this number comes with all sorts of caveats
- we have ignored seasonal forcing. I have little idea how strong of an effect this is, but a recent investigation in Australia demonstrated that influenza dynamics is highly synchronized across climatically very distinct regions. Hence I would expect its influence on growth rates minor. But it could turn the 45% into 30% if one third of the before/after season difference was due to the environment.
- we have ignored interactions with other respiratory diseases. The average innate antiviral immunity could be modulated by the number of viruses going around, effectively reducing the basal susceptibility to such disease.
- all sorts of other things
Influenza attack rates \(\Delta \alpha\)
Varies studies estimate the fraction of the population that suffers from influenza during a season. These estimates are typically in the range of 5-10% for adults and 20-30% for children. Some studies estimate attack rates for the general population as high as 30%. While I don't see an immediate way to infer the attack rate from the data analyzed above, we can still explore the consequences that different attack rates would have.
Low attack rate scenario: 5%
In this case, \(\Delta \alpha=0.05\) and the susceptible fraction \(\alpha \approx \Delta\alpha/0.4 \approx 0.1\). This would imply a bare \(R_0\approx 10\) which is on the high end of the credible range.
If our estimate of \(\Delta\alpha/\alpha\) is too high, the estimate of \(\alpha\) would be higher and hence \(R_0\) lower. But even with \(\Delta\alpha/\alpha \approx 0.25\), we would infer \(\alpha=0.2\) and \(R_0=5\).
An attack rate of only 5% would imply that people get infected by a any subtype every 20y and hence by a given subtype only every 30-60y (most years are A/H3N2 dominated, B and A/H1N1 would essentially only infect a given individual once or twice in a life time). Again, this seems implausibly low to me.
Medium attack rate scenario: 15%
Here, we would expect a susceptible fraction \(\alpha \approx 0.3-0.5\). This would imply a bare \(R_0\approx 2-3\) which is not unreasonable and concordant with estimates by Yang, Lipsitch, Shaman. PNAS, 2015. People would suffer from influenza every six years with the individual strains infecting people every 8-20 years. This is consistent with the rate of antigenic evolution of the different lineages. Ferret HI titers against A/H3N2 viruses drop by a factor of two every 1.4 years, while HI titers against B viruses drop by a factor of two every 5-10 years, see Neher et al and Bedford et al.
High attack rate scenario: 30%
Here, we would expect a susceptible fraction to be close to one and the pre-season growth rate would be similar to the bare \(R_0\approx 1.5\). An attack rate of this magnitude would also imply that no lasting immunity is build up and people that suffer from influenza one year are susceptible to influenza the next year. This scenario would require a large fraction of asymptomatic infections to be plausible.
Conclusion
The simple minded analysis of fitting increasing exponentials to the number of positive tests in the US gives estimates of the effective \(R_e = 1+\beta D\) of around 1.3 for A/H3N2 and 1.2 for the other lineages, consistent with previous estimates by Yang, Lipsitch, Shaman. PNAS, 2015. Together with the rate at which the epidemic collapses after the season, we estimated the ratio of attack rate and susceptible fraction \(\Delta \alpha/\alpha\) to around 40%. This number is sensitive to a number of assumptions, violation of which would reduce this fraction.
The attack rate itself is difficult to estimate from these data, but assuming an attack rate of about 10-15%, we get plausible values of \(R_0\) around 3 and a dynamics that is consistent with patterns of antigenic evolution.
Appendix
Week of peak activity and peak width by subtype

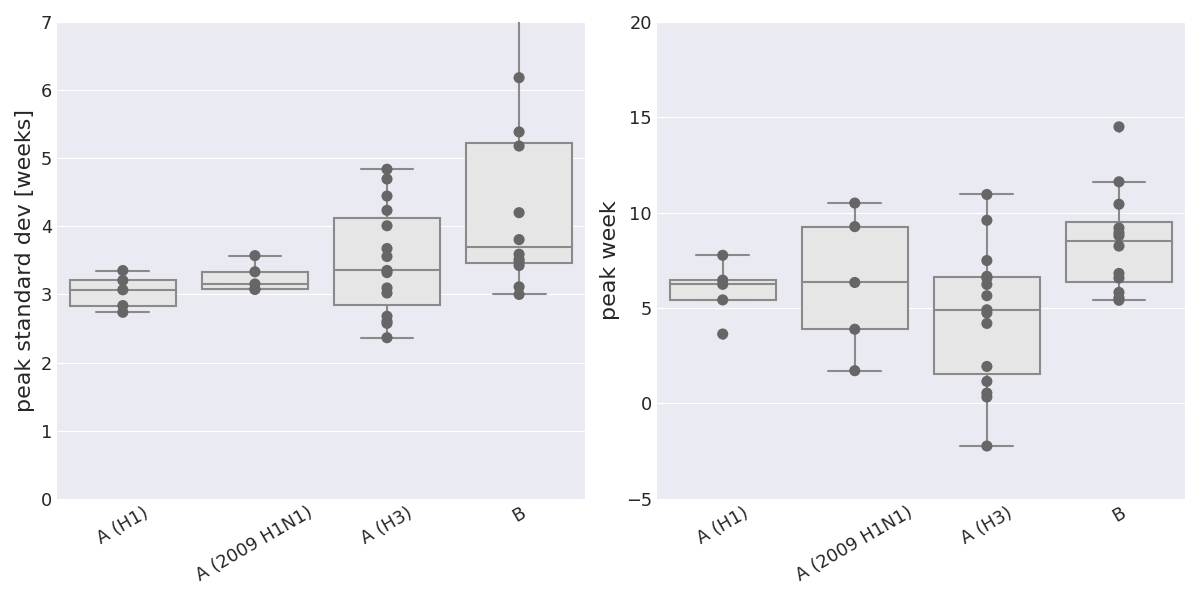
The Gaussian fit to the number of positive tests has parameters for the standard deviation and peak position for each season and subtype with substantial circulation. Influenza B tends to peak slighly later than influenza A and has slightly broader peaks. (The full-width-half-maximum (FWHM) equals \(2.4\sigma\)).
Scripts and data
- influenza_dynamics.py: Script that generates the plots
- parse_epi_data.py: Script containing short routines to parse the data
- ILI_data
- Positive tests prior to 2015
- Positive tests since 2015