Setting up your system
If you know what you are doing, install the necessary program (see yaml file below) via whatever method you like best. Otherwise, I suggest you install the programs and libraries we will need via the package manager conda. To install conda, follow the instructions relevant for your operating system. On linux, this could be achieved by these two commands:
wget https://repo.continuum.io/miniconda/Miniconda2-latest-Linux-x86_64.sh
bash Miniconda2-latest-Linux-x86_64.sh
To install the packages we need, create (or download) the following file that specifies the dependencies
name: xlab
channels:
- bioconda
- defaults

dependencies:
- python=2.7
- biopython>=1.66
- numpy>=1.10.4
- scipy>=0.16.1

- fasttree>=2.1.9
- iqtree>=1.5
- mafft>=7.305
Then install all these dependencies on a specific environment via
conda env create -f xlab.yml
source activate xlab
Influenza virus sequences
Download the file H3N2_Australia.fasta and open it in a text editor. This file contains influenza virus genomes (more precisely the segment HA of H3N2 viruses sampled in Australia). You should see something like this
>A/Brisbane/1/2017|01/02/2017|Australia|H3N2
GGATAATTCTATTAACCATGAAGACTATCATTGCTTTGAGCTGCATTCTATGTCTGGTTTTCGCTCAAAA
AATTCCTGGAAATGACAATAGCACGGCAACGCTGTGCCTTGGGCACCATGCAGTACCAAACGGAACGATA
...
This is the so-called fasta file format. A line that starts with > contains the name of the sequence (in this case a concatenation of name, data, country and subtype).
All other lines contain the actual sequence.
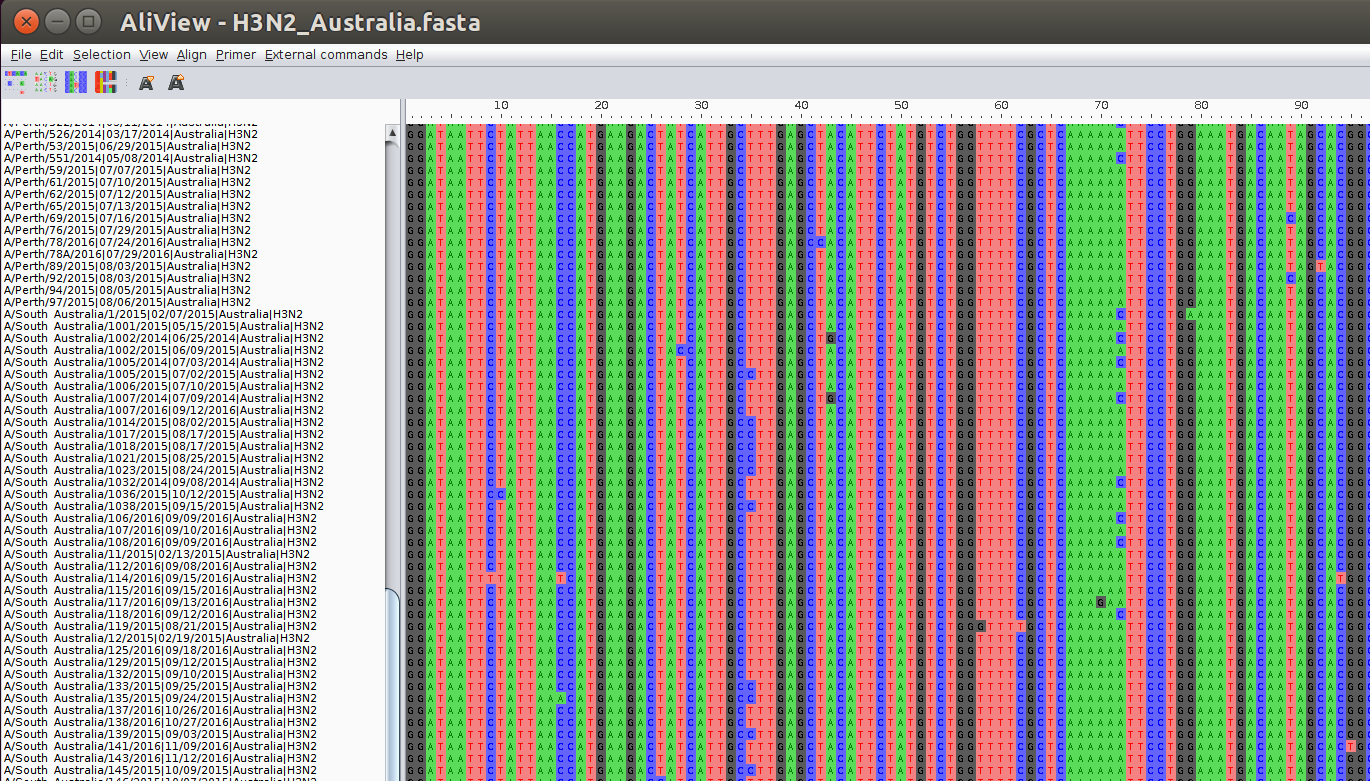
A more convenient way to explore such sequences is via a dedicated alignment viewer such as aliview.
If you want, download and install it.

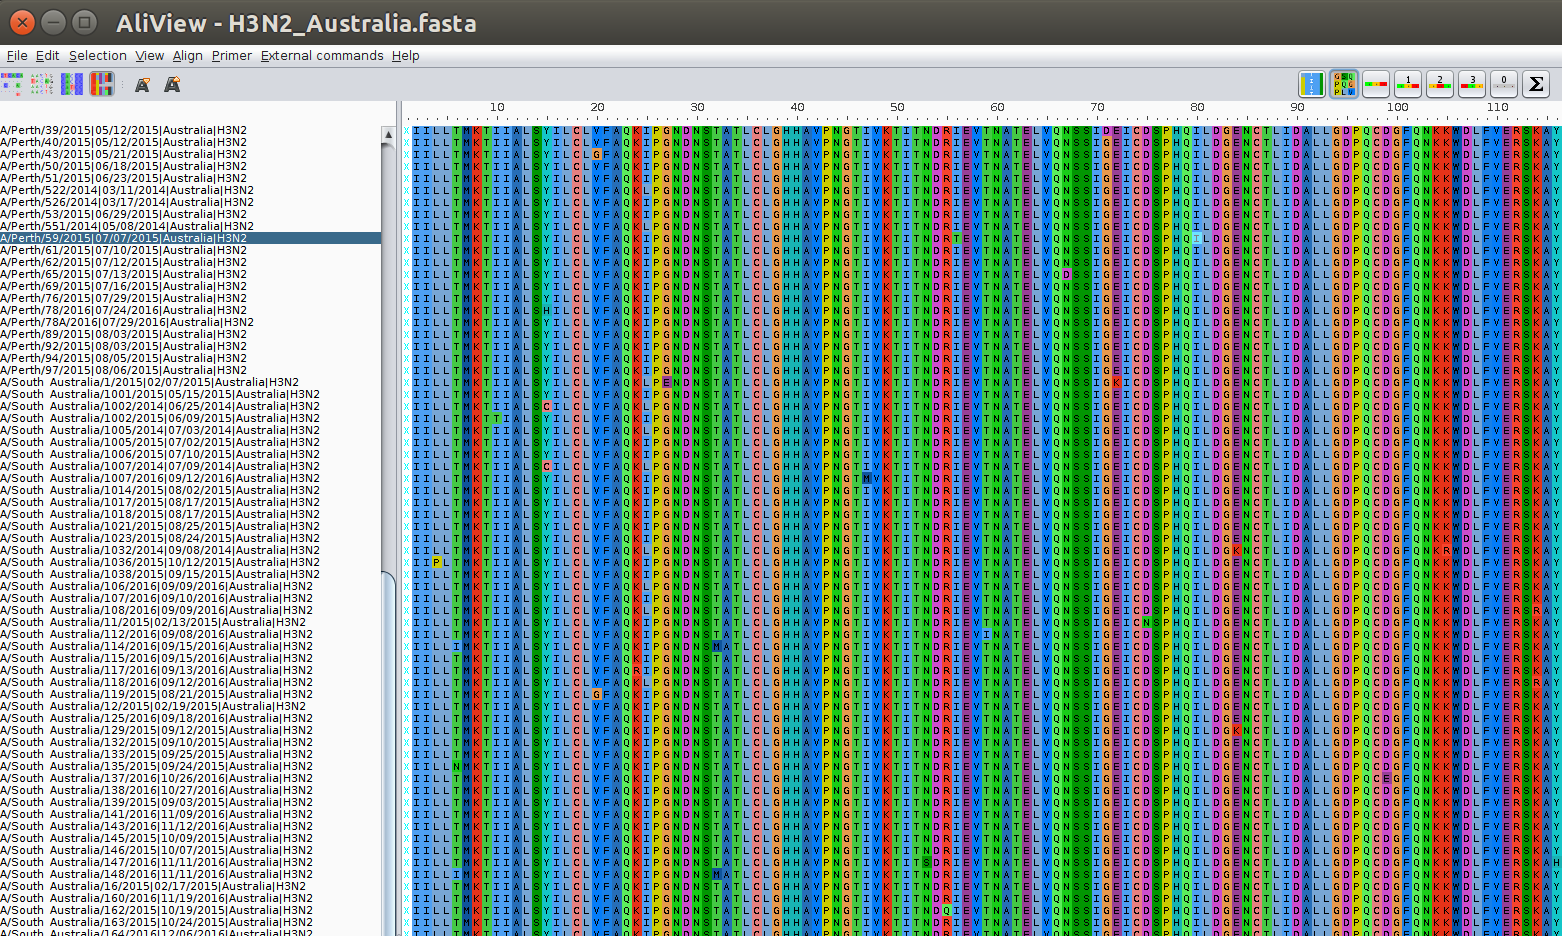
The different nucleotides (A,C,G,T) in this sequence are colored differently. The isolated differences between the sequences correspond to mutations that happened somewhere in the history of the sample. The sequences in this alignment code for a protein and the alignment viewer has the functionality to translate the nucleotide sequences into amino acid sequences.

The genetic code maps nucleotide triplets (so called codons) to amino acids. In this case, codons start at the 2nd positions, i.e., the reading frame is +2.
Sequence alignment
The sequences in the file above are already aligned, that is corresponding nucleotides are arranged in columns in the alignment.
This is not necessarily the case.
Sequences could simply have different length (parts at the beginning or end are missing in some sequences), or during evolution some parts of the sequences might have been deleted or other inserted.
In this case, we need to align the sequences (insert gaps - at the appropriate places) to make sure corresponding nucleotides are in the same column.
In this context, corresponding positions are positions that share a common ancestor, and in general such positions are more likely to be in the same state.
ATCTCGTCG---ACTC
||...|X||...||X|
AT---GACGGCGACGC
To score and compare alignments, one typically assigns a positive score to a match |, a negative score to a mismatch X and gaps.
The optimal alignment of a pair of sequences can be computed in polynomial time (square of the length of the sequence) via a dynamic programming scheme (transfer matrix type for the physicists), but alignments of multiple sequences are in general a hard problem.
A fast but accurate mutliple alignment tool is mafft.
Phylogenetic tree reconstruction
Sequences of the same influenza virus segment descent from a common ancestor without recombination.
Their history is hence described by a tree that links the common ancestor to all offspring.
Tree reconstruction is in general hard since there are super exponentially many trees.
In most cases, however, efficient heuristics give accurate results.
A reliable but fast tree reconstruction package is iqtree.
To construct a tree from the sequences above, type the following on the command line
iqtree -s H3N2_Australia.fasta
This will generate a number of files and the one ending on treefile will contain the tree.
This tree is written in the so-called newick format that groups sequences like so
((A:0.1, B:0.12):0.05,C:0.13);
To look at the tree you just constructed, do the following in ipython:
from Bio import Phylo
T = Phylo.read('H3N2_Australia.fasta.treefile', 'newick')
T.ladderize()
Phylo.draw(T)
this should open a window with a graphical depiction of the tree.