Genome sequences record pathogen transmission
Pathogens spread by through rapid replication in one host followed by transmission to another host and an outbreak can only take off when one infection results in more than one subsequent infections. As the pathogen replicates and spreads, its genome needs to be replicated many times and random mutations -- copying mistakes -- will accumulate in the genome. Such random mutations can help to track the spread of the pathogen and learn about its transmission routes and dynamics.

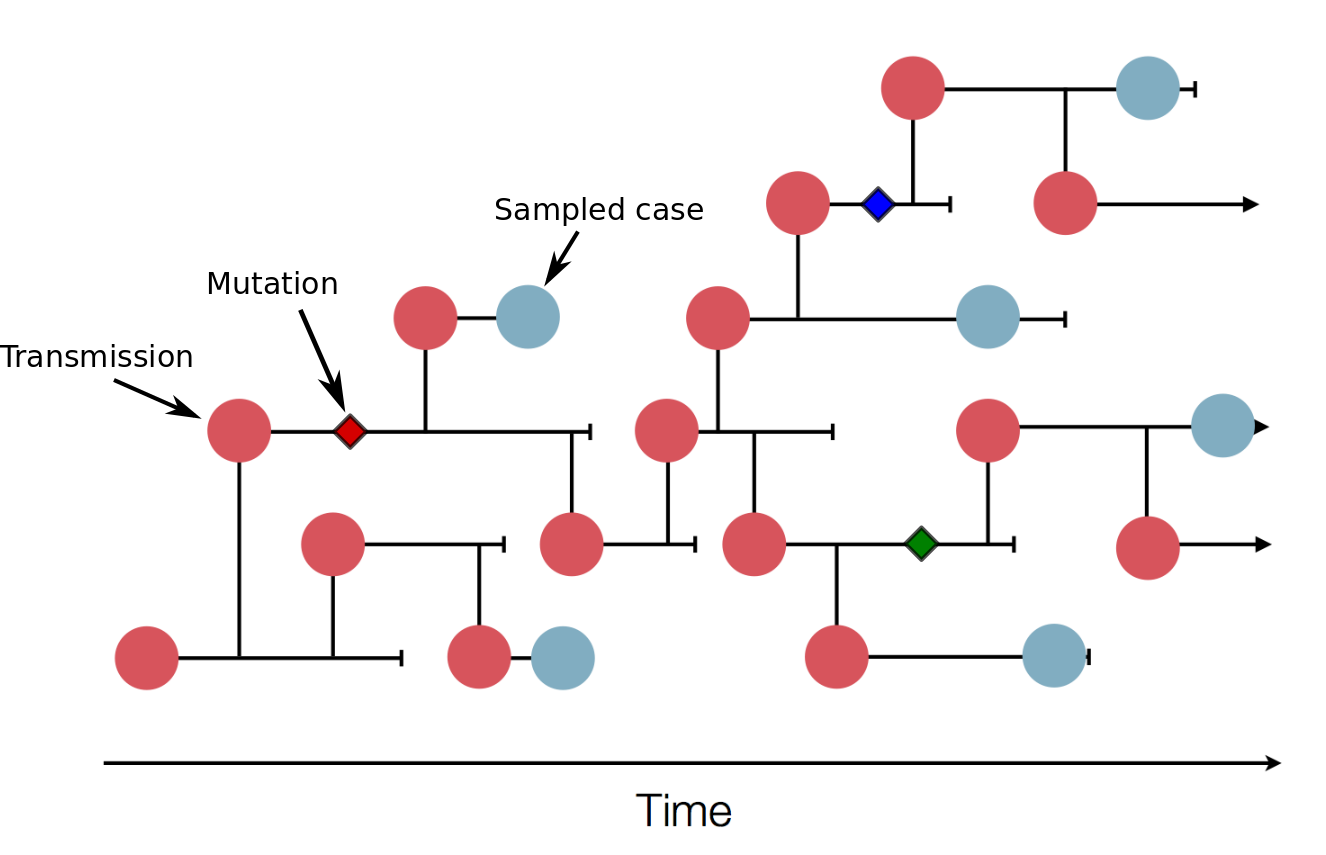
The illustration above shows a transmission tree with a subset of cases that were sampled (blue). In practice, the transmission tree is unknown and typically only rough estimates of the total case counts are available. Genome sequences, however, will allow us to reconstruct the transmission tree. In this example, three mutations (little diamonds) are indicated on the tree and these mutations allow us to group samples into clusters of closely related viruses that belong to the same transmission chains. Real data will contain many more mutations and many more samples that allow detailed reconstructions.
Sequence data
Sequencing of pathogens from patient samples and the processing of the raw sequence data won't be discussed here. We start assuming we have genome sequences of the same pathogen sampled from many cases during an outbreak. These will typically come as text files in fasta format:
>Sample_A
ACTGCTCGATCGCTACGCTACGCTA...
>Sample_B
CTGCTCCATCGATCGCTANNNN...
>...
Each line that starts with a '>' sign is interpreted as a line that specifies the name of the sample, followed by the sequence. The sequence can be broken over several lines. Sequences obtained in outbreak scenarios will often be incomplete. Unknown bases are typically denoted by 'N', but other characters like '?' or '.' are also common.
Fasta files like the above will be the point of departure for the phylogenetic analysis that follow.
Alignment
Partial genome sequences typically don't all start in exactly the same place and mutations not only change the nucleotide content but can also delete or insert a couple of bases. As a consequence, the different sequences are not in register and need to be aligned. Such alignments are a common task in bioinformatics and many robust programs are available to solve this problem. The aim is to insert gaps into the sequences, encoded with character '-', that corresponding characters are in the same column. For the two sequences from above, this would look like this:
ACTGCTCGATCGCTACGCTACGCTA...
-CTGCTCCATCGAT-CGCTANNNN...
At most positions, the two sequences now agree. Formally, alignment is trying to insert gaps such that homologous parts (i.e. parts that descent from a common ancestral sequence) of the sequence are in the same column. Common programs to perform this task are
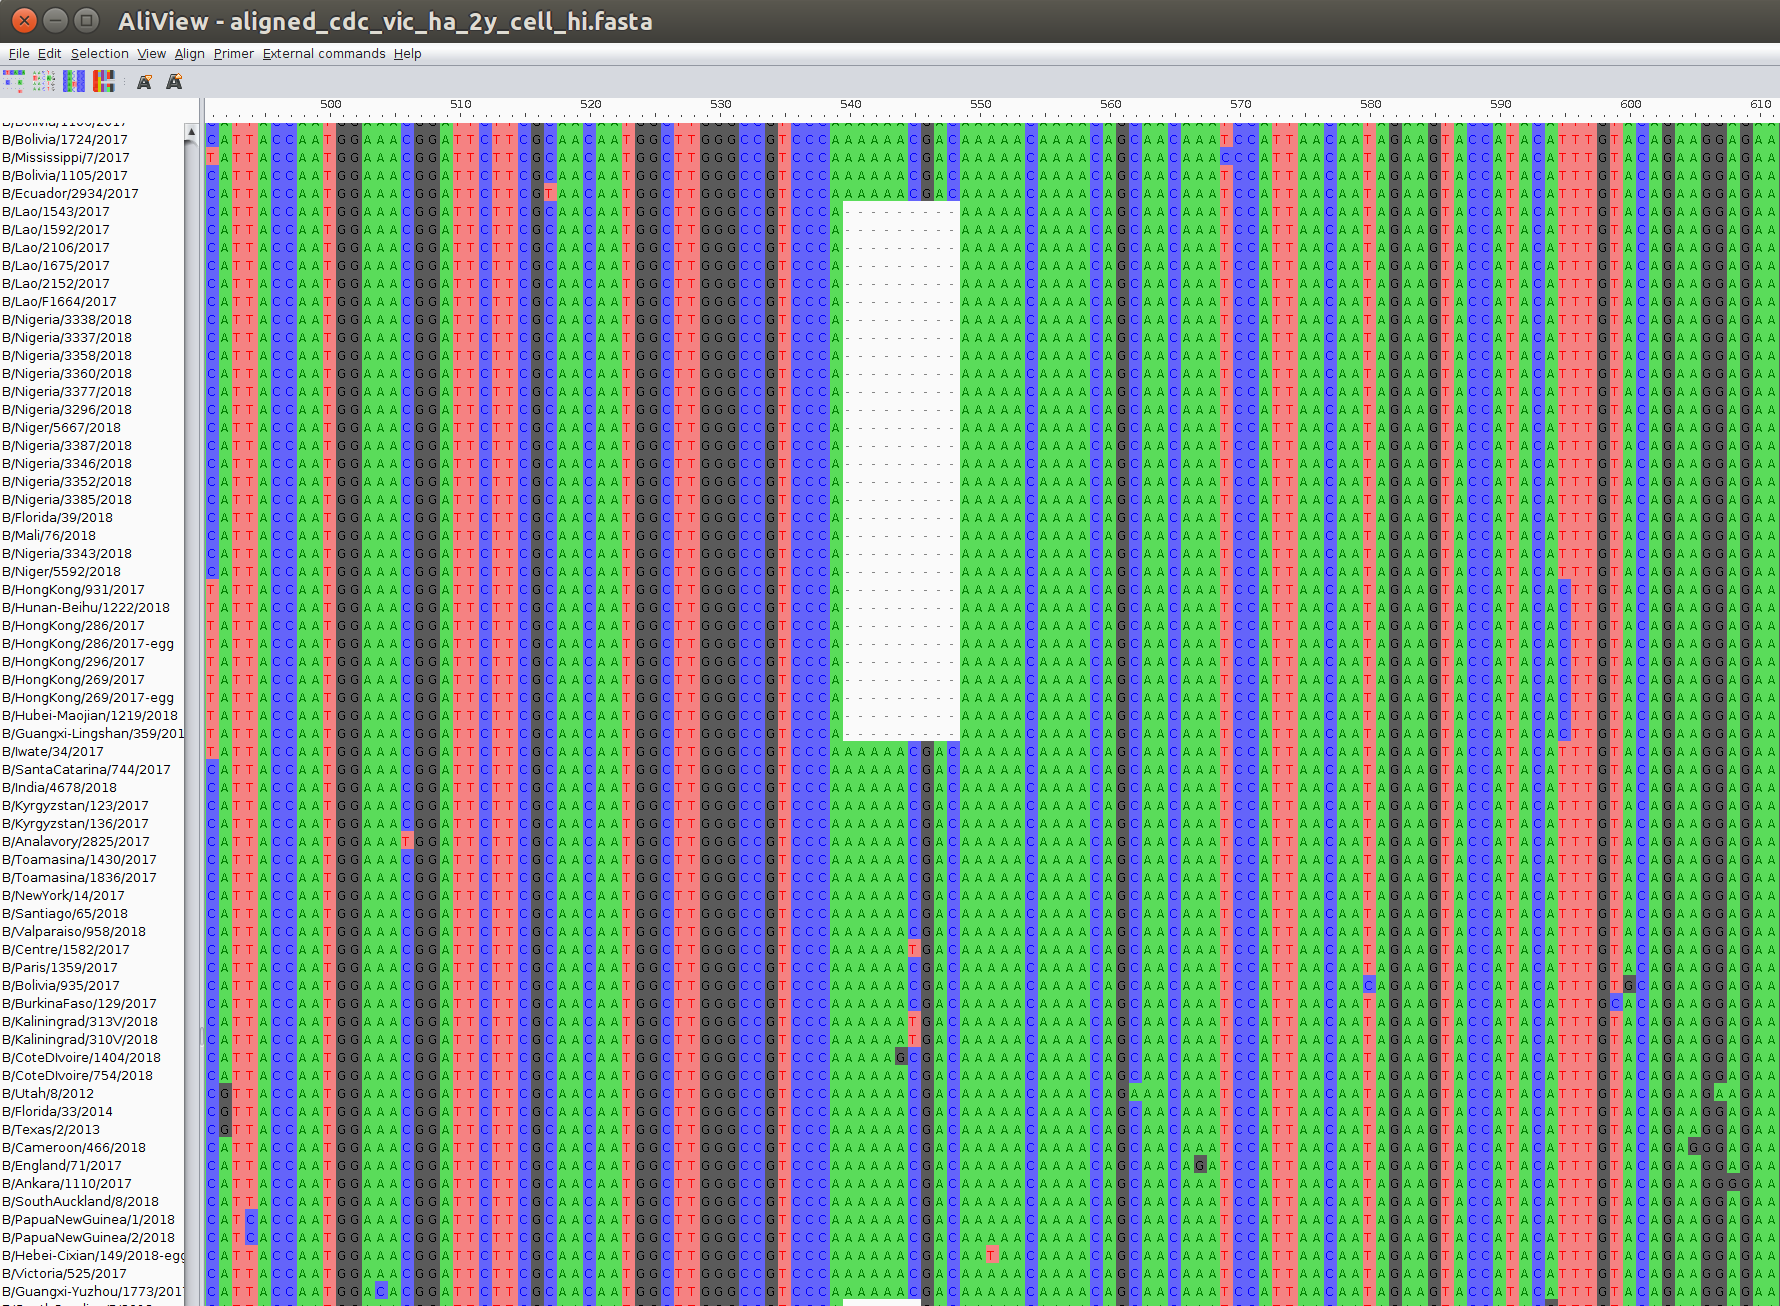
The output of an alignment is best viewed (and edited) in specialized multiple alignment viewers. My favorite one is aliview:

Phylogenetic trees
Once sequences are aligned, we can meaningfully look for differences between them and group them into clusters of similar sequences, which in essence boils down to reconstructing their "family tree" or evolutionary history.
One the right, different colored balls indicate differences between the sequences that we assume originated in a mutation event in a common ancestor of all sequences that carry the variant. In this simple example, it is straightforward to group sequences according to the mutations they carry -- in practice finding the tree that explains your data best is a computationally challenging problem. But a large number of highly optimized programs are available to solve this task. We will use one of the following three
- IQ-TREE: Fast and accurate
- RAxML: Current gold standard, but slower than IQ-TREE
- FastTree: Fast and rough, but often good enough (depends who you ask)
The most common output format of these programs is called newick format. The branch length of trees estimated by the above programs roughly correspond to the fraction of positions in the sequence that changed along the branch (more precisely the expected number of changes per site).
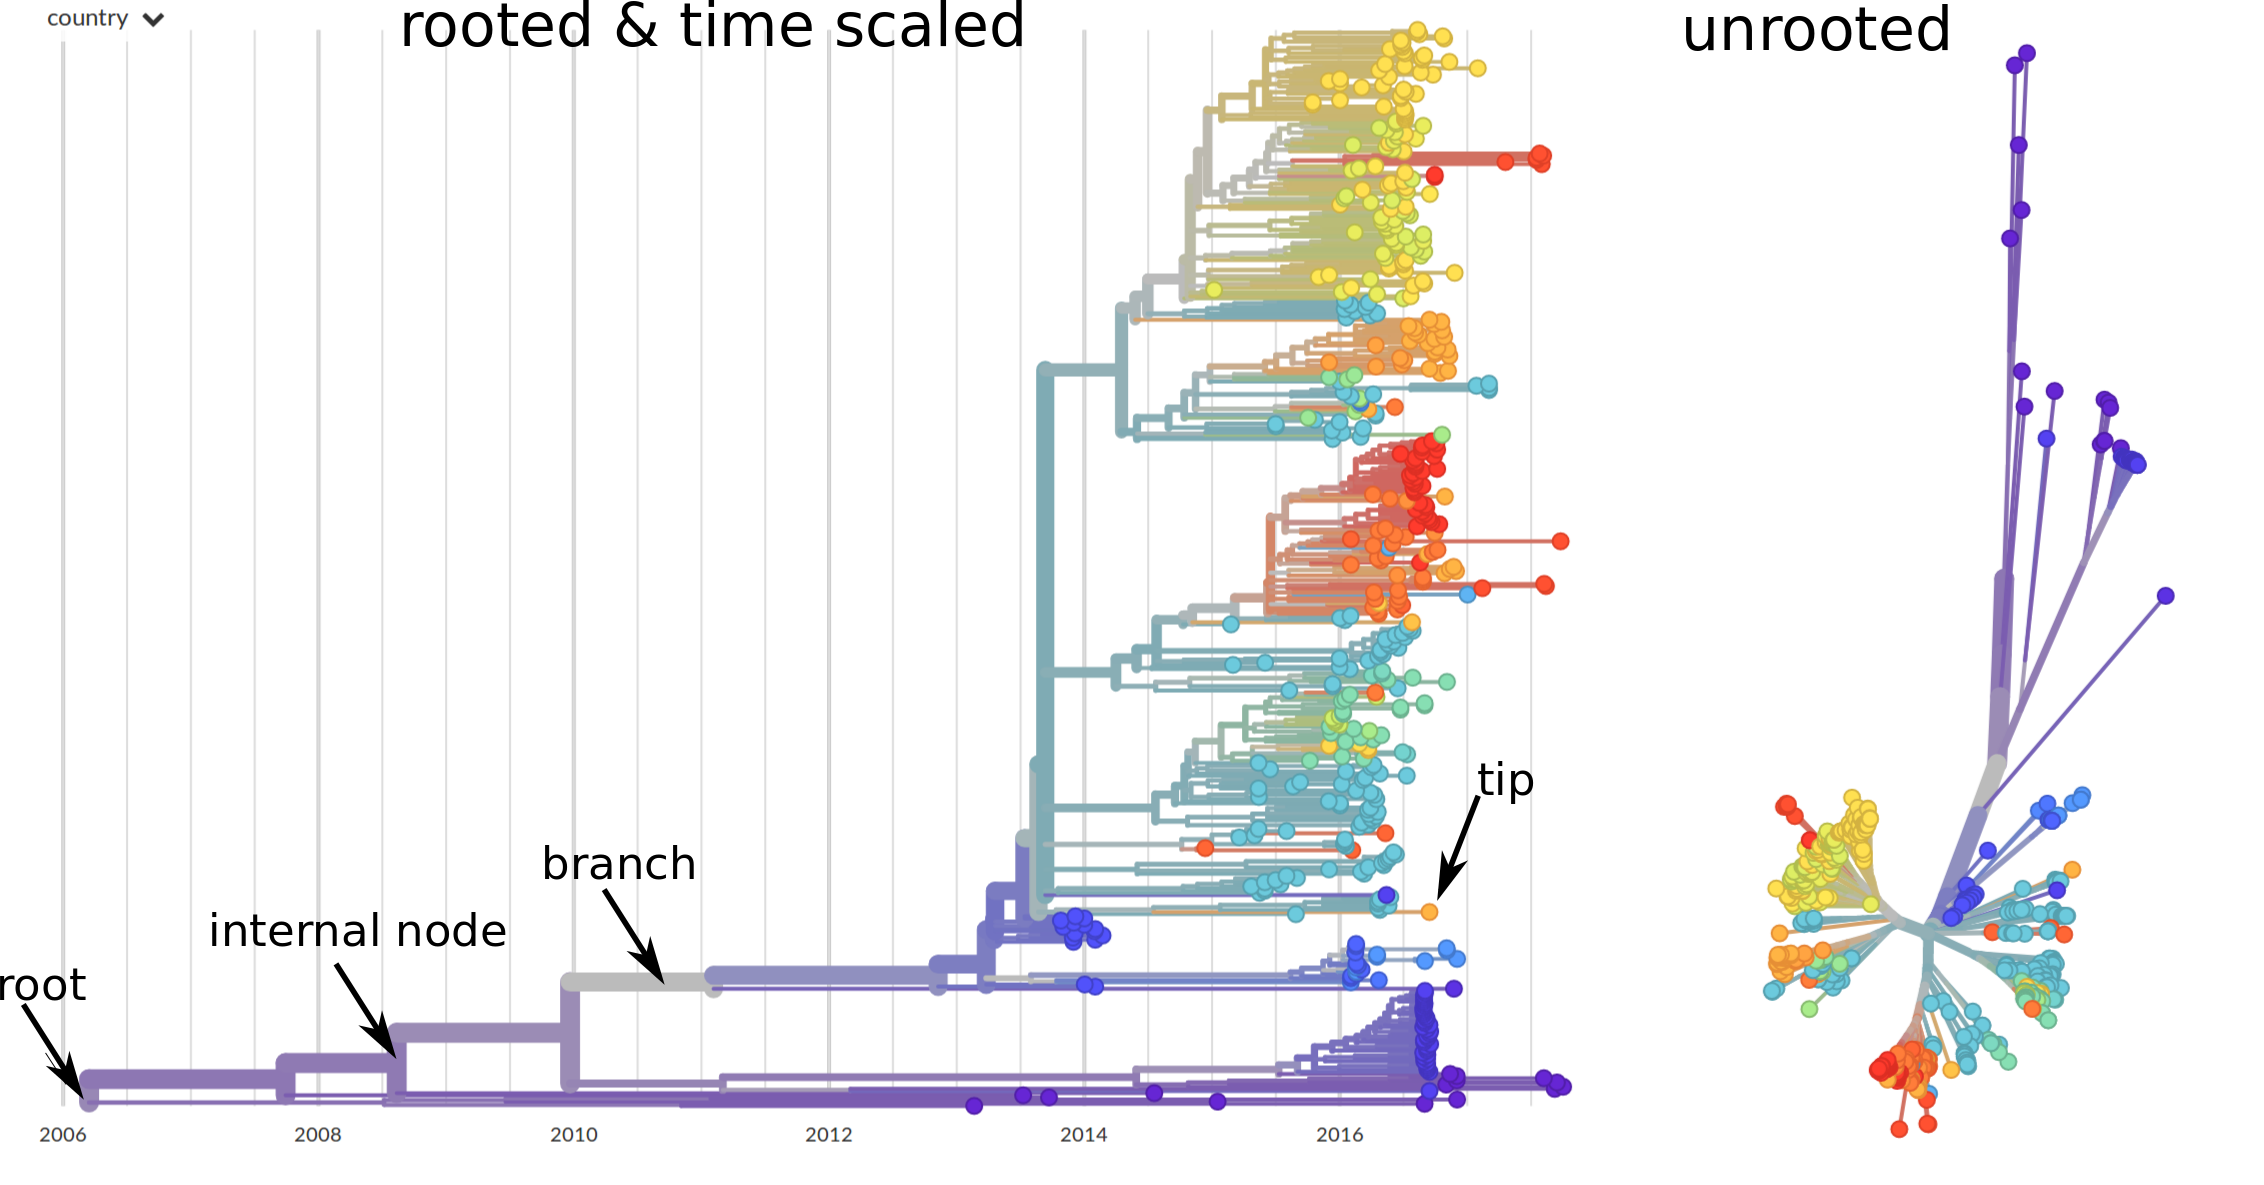
Trees can graphed in different ways. The most important distinction is whether a tree is rooted or not. In a rooted tree (the left example below) a particular bifurcation is the ancestor of all sequences in the sample. Time scaled phylogenies (where branch length corresponds to time) will always be rooted and the root is by necessity the oldest node. In other applications, it is difficult to single out a root node and a more appropriate layout is and unrooted layout shown on the right.

Molecular clock and transmission
The number of changes accumulate in a pathogen genome in a year depends on
- the mutation rate
- the duration of one replication cycle
- the size of the genome
- the fraction of mutations that persist and spread
While the first three factors are very natural and intuitive, the last one depends on the biology of the pathogen and the environment it is replicating in. The majority of mutations that change the sequence of important proteins will be detrimental and are quickly removed by natural selection, while other mutations, for example those that help a virus to evade human immunity, will preferentially spread. In addition, a substantial fraction of mutations (mostly mutations at 3rd codon positions) don't affect pathogen replication much and accumulate freely. As a consequence, the exact rate at which changes accumulate is not known a priori. Nevertheless, mutations tend to accumulate at a constant rate and the accumulation can be used as a molecular clock.
The molecular clock is a relationship between time and the expected number of changes in the sequence. These substitution rates vary greatly between organisms and within organisms between genomic regions
- RNA viruses: \(0.0001\ldots 0.01\) substitutions per site and year
- bacteria: \(10^{-8}\ldots 10^{-6}\) substitutions per site and year
Multiplying the rate per site with the size of the genome, we get the expected number of substitutions per year:
- RNA viruses: Genome size \(\approx 10^{4}\) → 1-100 substitutions year and genome
- bacteria: Genome size \(5\times 10^{6}\) → \(0.05 - 5\) substitutions per year and genome
This suggests that whole genome sequencing often has high enough resolution to distinguish pathogens that were sequences a few month apart -- sometimes even down to a few weeks.