The rate at which amino acids change through evolution varies greatly among the positions in a protein. Such rate variation is obvious in rapidly evolving RNA viruses: some sites are conserved over millions of years, while others change every few years. It has long been realized that it is important to model rate variation in phylogenetic inference and modern phylogeny programs typically account for this summing over many possible values of the rate at every site.
A correct model of rate variation is particularly important when comparing sequences that are distant enough that rapidly evolving sites have likely undergone multiple changes shadowing each other. Ignoring rate variation and the resulting partial saturation will then lead to underestimates of branch lengths. When comparing very similar sequences, the effects of rate variation are less dramatic since multiple hits are rare and the number of differences between the sequences is still linear in the time that separates them. But how dramatic is rate variation in RNA viruses, on what time scale does it kick in, and do standard methodologies correctly account for it?
Recurrent mutation in seasonal influenza
Seasonal influenza viruses provide a unique opportunity to shed some light on this question. The HA protein undergoes rapid evolution driven by immune selection. Most of this immune escape happens at a small number of epitope sites while other sites don't change often. We thus expect strong rate variation. Seasonal influenza is unique in that we have abundant longitudinal data. HA sequences are available covering approximately 90 years for subtype A/H1N1 (1918-2009) and 50 years for subtype A/H3N2 (1968-2019).
50 years of A/H3N2 HA1 evolution -- 10%-20% relative error
To study the effect of rate variation and multiple changes, I estimated evolutionary distances between a recent sequence and the earliest sequence available using data sets consisting of:
- 3 sequences from 1968
- about 200 recent sequences from 2014 to 2019
- a variable number (0 to 125) of sequences between 1969 and 2014
The graph below compares two extremes: The tree on the left has 3 sequences from 1968 and a bunch from the 2014 onwards, but nothing in the between. The tree on the left has about 100 additional sequences covering the entire range from 1969 to 2014.
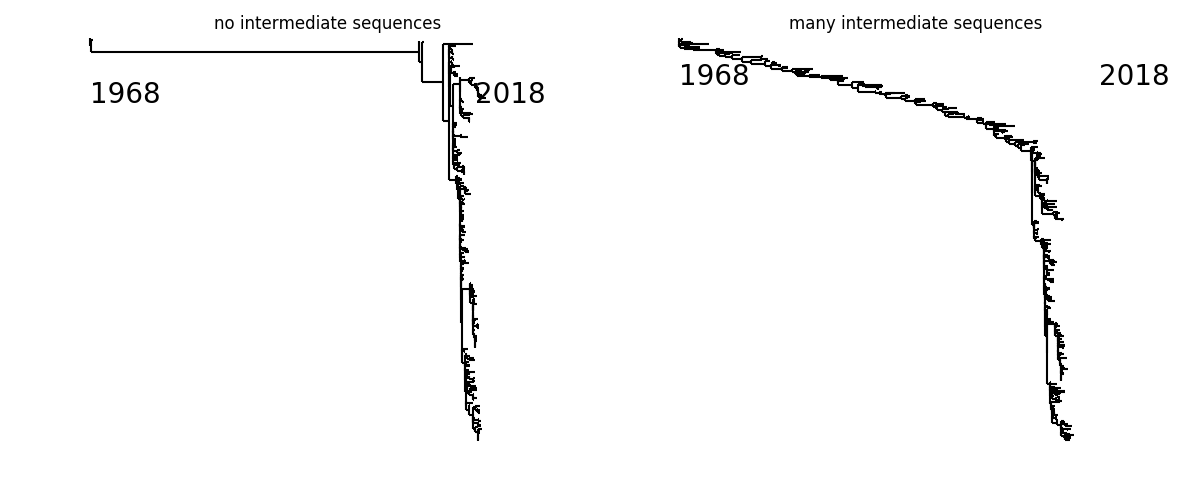
These additional sequences provide information on the evolutionary trajectory separating recent and early sequences and pin down unobserved intermediate states, thereby unmasking multiple changes at the same site.
What might look like 189Q -> 189K in the left tree is quite certainly 189Q -> 189K -> 189R -> 189S -> 189N -> 189K on the right (this is an illustrative if somewhat extreme example from A/H3N2).
By adding enough densely spaced samples, we are effectively chopping the long branch into many short branches on each of which we can observe mutations parsimoniously.
(Results from the same analysis without the 200 recent sequences shown below)
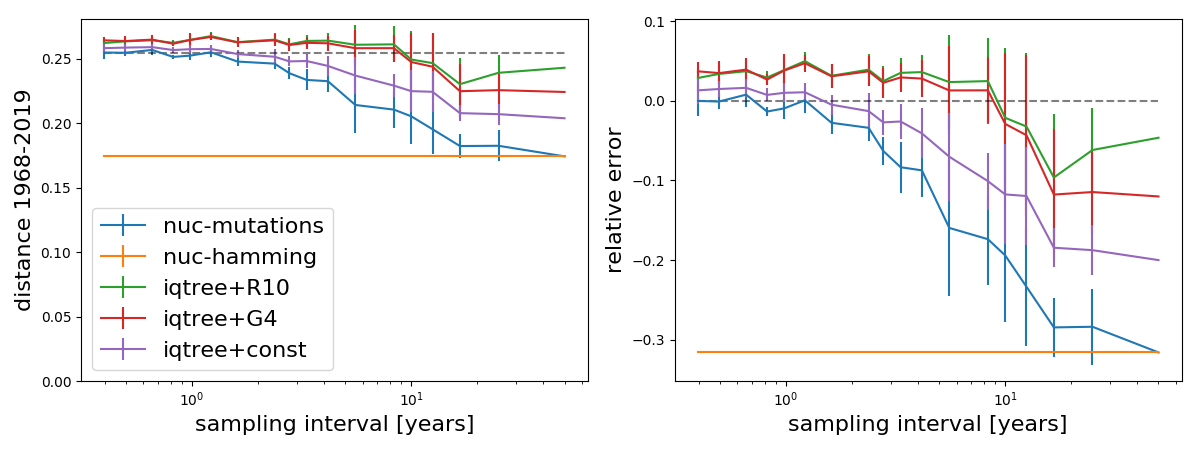
How well do phylogenetic models account for such unobserved substitutions? Adding more intervening sequences should not change the inferred evolutionary distances between a recent tip and the sequences at 1968 -- provided the reality conforms with the model. The plot below shows the estimated branch length between A/H3N2 from 1968 and contemporary viruses as a function of the typical interval at which the influenza population is sampled, that is the inverse of the number of sequences in the tree between 1968 and 2014.
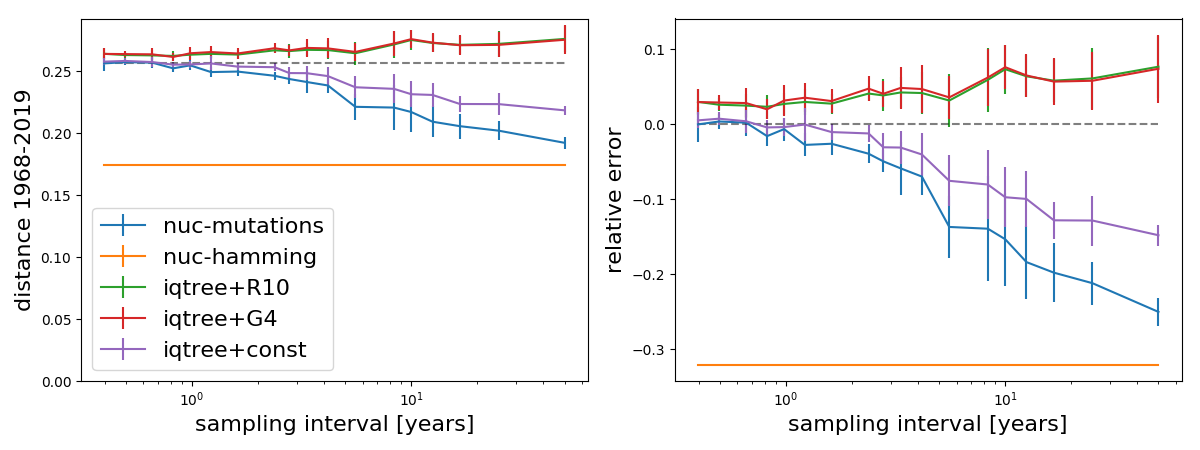
The orange line shows the hamming distance (~0.18) between the two endpoints, which of course doesn't change as we add data. The blue line shows the distance estimated by counting mutations mapped onto the tree by ML ancestral reconstruction. The distance estimated that way increases as more sequences are added since evidence mounts that many positions change multiple times on the tree. The plot also contains estimates by IQ-Tree using three different models of rate variation. Assuming no rate variation (const) shows a similar pattern as the "counting mutations" method, while models with rate variation (G4 and R10) tend to overestimate the distance. All these methods converge as more sequences are added to tree.
In the case of A/H3N2, the mutation counting method on a densely sampled tree should more or less give the correct number of substitutions between 1968 and now or in any case should be a close lower bound. Using this assumption, the right panel above shows the relative error made by different methods.
Models with rate variation overestimate divergence from 1968 to now by about 5-10%, while the model ignoring rate variation (const) underestimates the length by about 15%. Hamming distance after 50 years is about 2/3 of the true distance.
Amino acid alignments
The patterns change a bit when using amino acid alignments instead of nucleotide alignments:
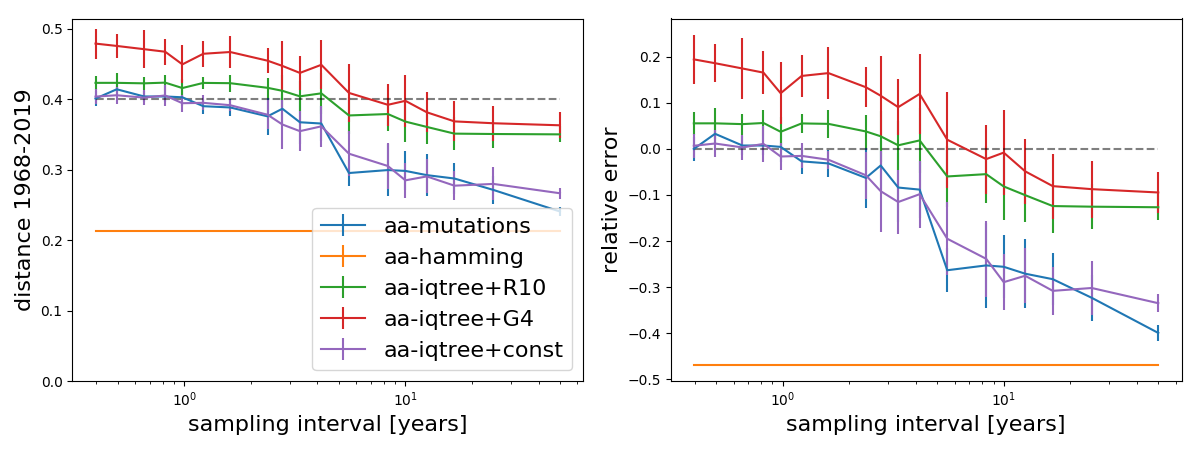
Now IQ-Tree w/o rate variation and the mutation count method show very similar trajectories. IQ-Tree LG+G4 seems off while IQ-Tree LG+R10 is less sensitive to additional tips but still varies by about 15% as more data is thrown in.
Amino acid sequences contain less information than the underlying nucleotide sequence, so the overall worse performance is not too surprising. Hamming distance now underestimates the distance by about a factor of 2, and models that don't account for rate variation underestimate distance by 30-40%. The LG-G4 and LG-R10 models implemented in IQ-Tree behave somewhat inconsistently and underestimate the branch length at one end of the spectrum, while overestimating it with densely sampled trees with errors ranging between -10% and 20%. This is worrying. The R10 (10 free rate categories) does better than the G4 model.
Conclusions
Ignoring rate variation introduces obvious and expected biases: 50 years of HA1 divergence is underestimated by 15% or 30% when using nucleotide or amino acid sequences, respectively. Modeling rate variation improves estimates, but introduces biases that are harder to anticipate: G4 or R10 models overestimate nucleotide divergence by about 5-10% while underestimating evolutionary distance from amino acid sequences. The G4 model in particular seems unreliable when adding more data.
Importantly, these errors are likely due to model misspecification rather than intrinsic stochasticity of the evolutionary process. One source of error is insufficient sequence variation in the 200 recent sequences to accurately infer rate variation. Another source of error has to do with the models themselves: While some models account for rate variation, all models tested above assume the same substitution matrix at every site. In reality, most positions only explore a subset of amino acids. Hilton and Bloom have for example shown that accounting for site specific preferences both improves the model fit dramatically and increases estimates of evolutionary distances. Model misspecification problems are expected to be severe when strong preferences of particular amino acids exist at rapidly evolving sites, as is likely the case for immune escape/reversion dynamics in HIV.
Just 50 years of influenza virus evolution results in substantial errors -- be careful when trying to extrapolate further back!
Data source
This analysis was done using data from the Influenza Research Database -- thanks to everyone out there contributing influenza sequence data.
Calls to tree-builders
iqtree -redo -fast -s input.fasta  -m GTR+{G4,R10}     # nucleotides
iqtree -redo -fast -s input.fasta  -m LG+{G4}          # amino acids
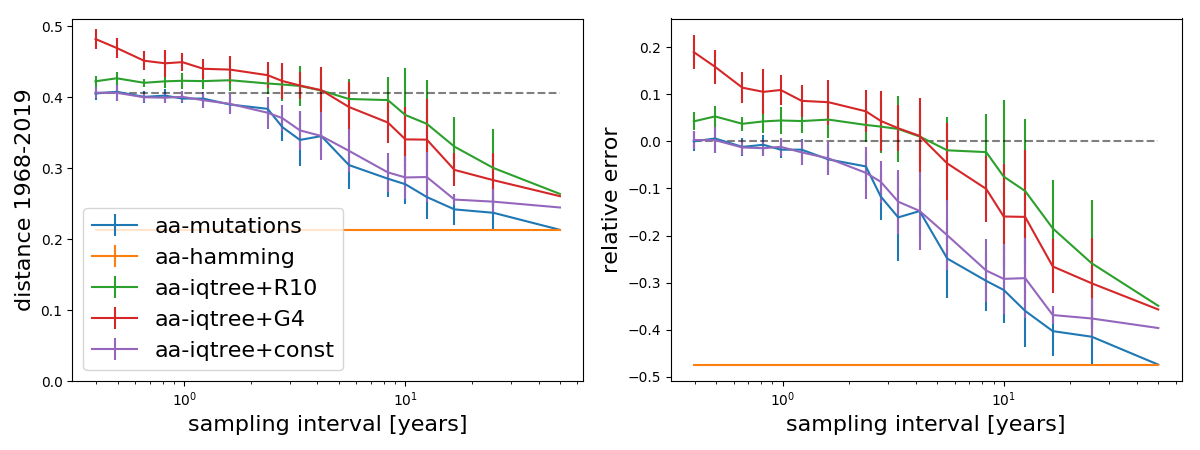
Branch length estimates without recent variation
The above analysis included A/H3N2 sequences from the last 5 years to allow the tree builders to estimate rate variation. The last 5 years cover multiple clades with a most recent common ancestor about 8 years in the past and thus correspond to more than a decade worth of evolution. Most rapidly evolving sites are variable in this sample. If we don't include these recent sequences, we find the following.
As expected, Hamming distance now equals the mutational distance at the largest sampling interval and inferences with the model without rate variation don't change. Models with rate variation now underestimate rather than overestimate long branches.
