Influenza viruses evolve rapidly, in part to evade recognition by human antibodies generated during previous infections. Mutations that change antigenic properties are common and rapidly spread through the virus population, making frequent updates of the seasonal influenza vaccine necessary. A close match between the vaccine and the circulating viruses is necessary to ensure vaccine efficiency
Antigenic change can be detected in HI
assays
with anti-sera raised against reference and vaccine viruses. Low titers
indicate that a virus is antigenically different from the virus used to
produce the serum (a reference virus). Members of the WHO Global
Influenza Surveillance and Response System perform many HI assays every
year to monitor antigenic dynamics of influenza. The results are
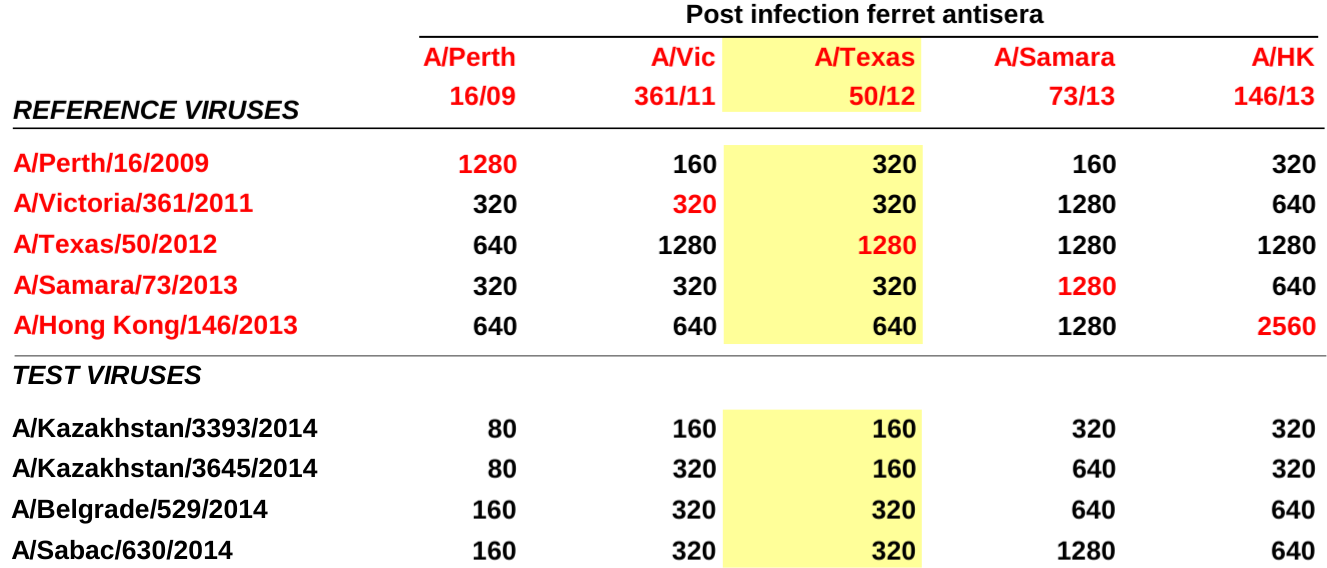
reported in tables like the one below from John McCauley and colleagues
at the Crick
Institute.

Each column corresponds to one anti-serum, each row to one virus. Large numbers indicated strong binding. The red values on the diagonal in the upper half highlight homologous titers, that is titers of serum against the virus it was raised against.
To explore and visualize such data, Derek Smith and colleagues have developed antigenic cartography, a variant of multi-dimensional scaling that maps titers to difference in two or more euclidean dimensions. Unfortunately, these 2D projections are difficult to combine with the genome sequences of the corresponding influenza viruses - a type of data that is becoming ever more abundant.
Integration of HI data with sequence data
Together with Boris Shraiman, Trevor Bedford, Colin Russell and Rod Daniels, we have developed models and visualizations to directly integrate HI titer data with influenza virus sequences and phylogenies. This work was published in PNAS this week. Our models infer antigenic distance as additive contributions of branches in the tree or similarly as illustrated below:

The titer distance is modelled either as a sum of terms on the path between virus a and b (used to raise the serum), or as a sum of contributions associated with amino acid difference between the sequences. Both models are similar and describe the data well, for details have a look at the paper.
Visualization of antigenic data on the tree
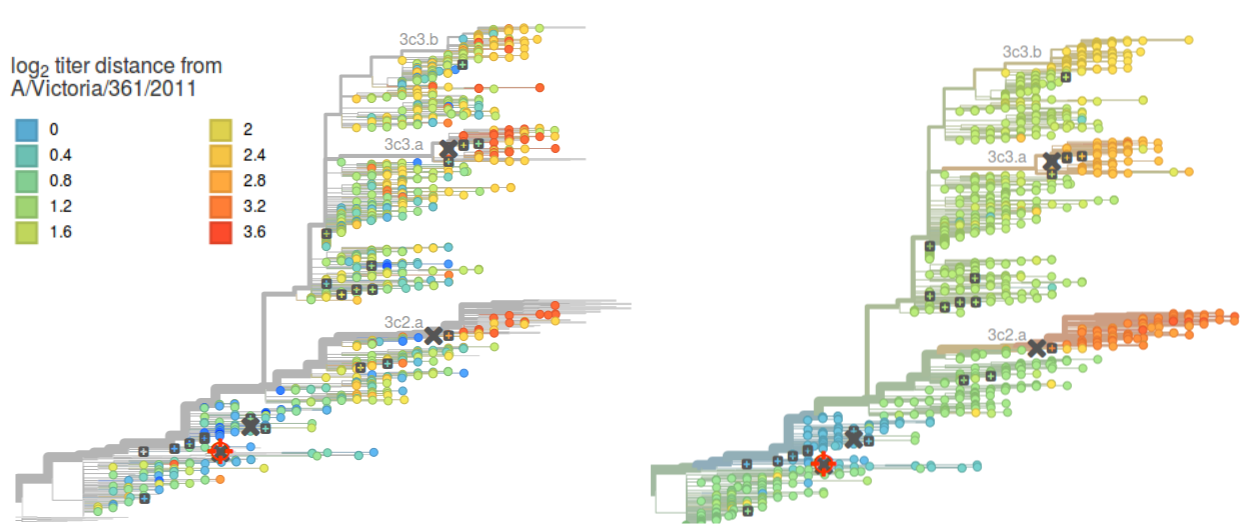
We used the models learned from the HI titer data to allow interactive exploration and visualization of measured and predicted titers within nextflu. nextflu.org will continue to be updated, while HI.nextflu.org will display the full data set available last summer.

Color indicates antigenic distance from the focal reference virus A/Victoria/361/2011 marked by the red cross-hair. The model on the right interpolates and smooths the data. The focal reference virus can be changed by clicking with the mouse on any other sera marked by grey boxes, upon which the tree coloring will be updated.
Predicting successful viruses
The ultimate goal of this project is to improve predictions of the composition of future influenza virus populations to optimize the vaccine match. We and others have developed methods to make such predictions solely based on sequence information. Here, we showed that successful strains tend to be antigenically advanced, but that blindly picking the most antigenically advanced strain often fails. To improve predictions, we need to find was to integrate antigenic information with other predictors of successful clades and carefully account for competition between clades.