The rates at which mutations arise and the effects these mutations have on phenotypes and replications are key determinants of how populations change and adapt - but measuring them is often hard. While mutation rates in animals or plants can be obtained quite easily by sequencing parents and children, fitness effects are much more difficult to ascertain: Only the most dramatic mutations have a big enough effects that can be measured over a few generations or leave strong signals in genetic diversity.
In viruses like HIV-1, mutation rates and effects of mutations are more readily accessible since their generation times are short and their genomes are compact. However, these measurements cannot be done in the natural environment - the infected host - but typically in cell culture systems. In our new preprint, Fabio, Vadim, myself and our colleagues Johanna and Jan from Sweden present estimates of mutation rates and fitness costs in-vivo.
How did we do it?
We have previously presented longitudinal whole genome deep sequencing data from multiple patients (Zanini et al, 2016). At each position of the genome, we can observe the frequency of different mutations at different times during the course of infection.
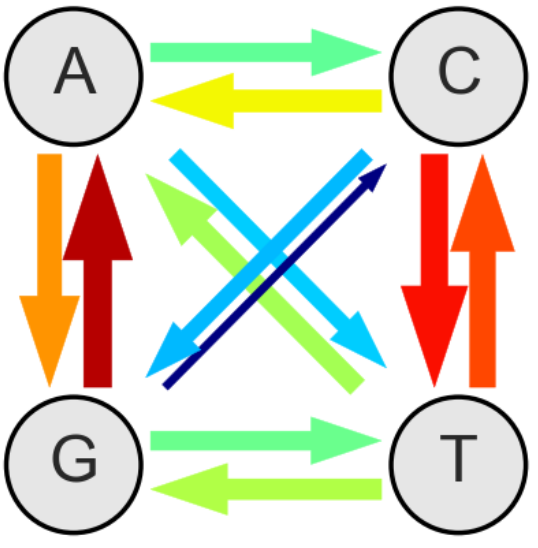
A subset of positions don't seem to matter much for virus replication. We found that at those sites, mutations accumulate almost linearly. The rate of accumulation is the in vivo mutation rate. The estimates so obtained agree very well with cell culture estimates. The figure below summarizes these findings: The thickness of the arrows indicate the relative rates - the overall rate is 0.000012 mutations per site and day.

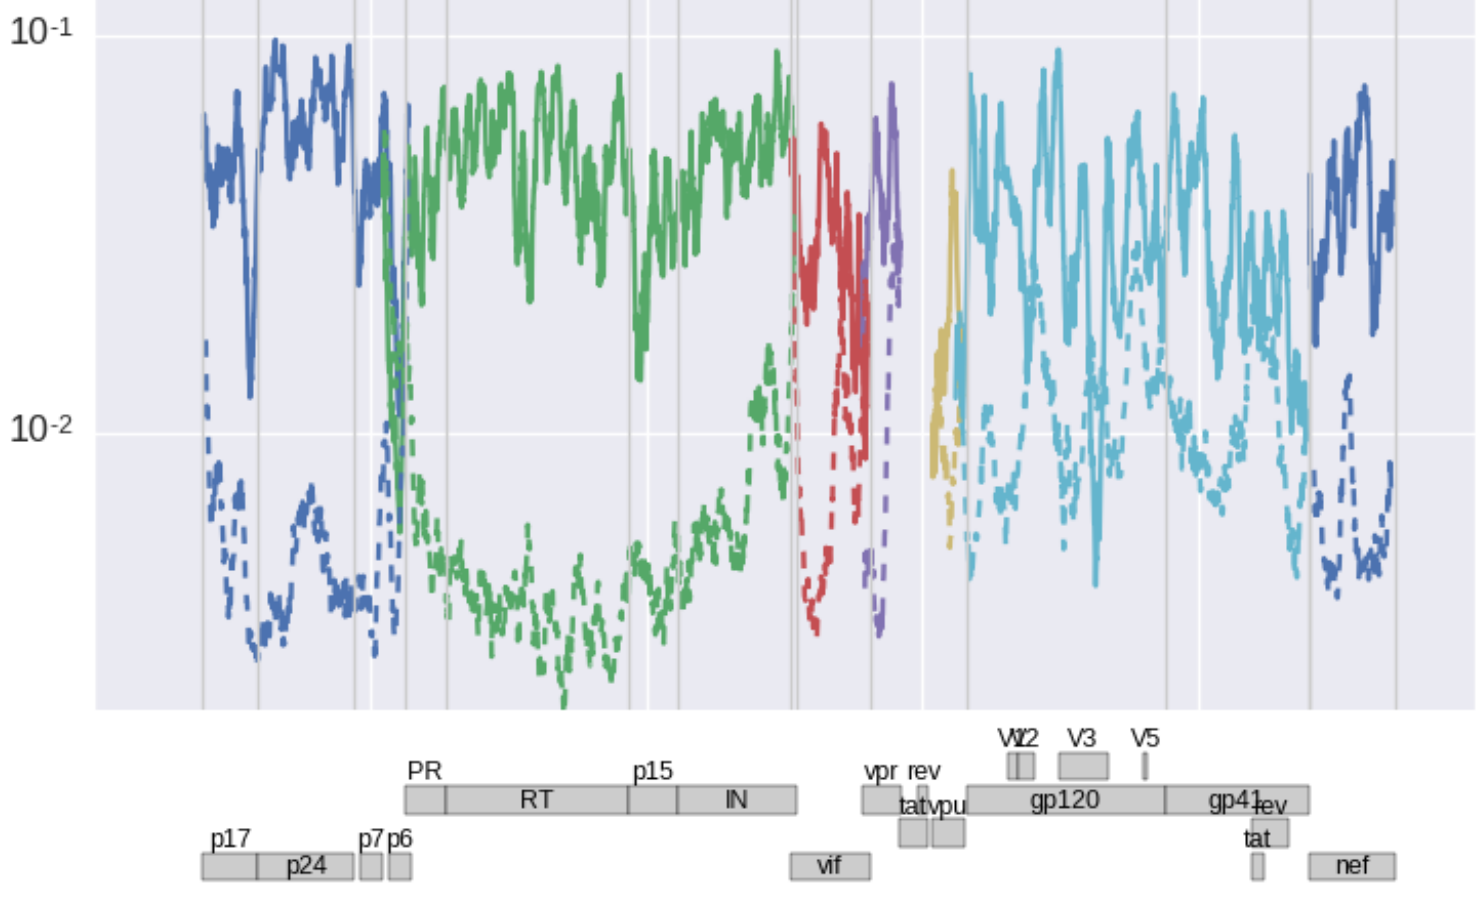
At these approximately neutral sites, mutation accumulation is linear (at least over the few years we looked at it). At other sites, mutations arise very much the same way, but they reduce the rate of virus replication and are hence weeded out. As a result, mutation frequencies don't accumulate linearly but saturate. The time its takes to saturate and the level at which the frequencies saturate depend on the selection coefficient. We use this dependence to estimate the landscape of fitness costs at almost every site of the HIV-1 genome.
[ This graph shows a slightly smoothed landscape of fitness costs in units of
1/day separately for non-synonymous mutations (solid) and synonymous
mutations (dashed) for the major genes of HIV-1 (colors). As expected,
fitness costs of non-synonymous mutations are a lot larger than those of
synonymous mutations (about 50% of nonsyn mutations have costs of 10% or
more). But subsets of synonymous mutations are also very costly, in
particular in RNA secondary structure rich regions at the 5' end or in
envelope.
Challenges
Estimating fitness costs requires accurate estimates of mutation frequencies. The accuracy of the latter is limited by small numbers of HIV genomes that enter the sequencing library, amplification biases during PCR, and possibly through hitch-hiking effects that bring deleterious alleles to high frequencies. To nevertheless get reasonable estimates of fitness costs at individual sites, we used weighted averages of all sequenced samples that we had available. This is sensible, since the frequencies of deleterious mutations decorrelate rapidly such that different samples from the same patient are approximately independent. By combining multiple samples with weights proportional to the number of genomes contributing to the sample, we generate a meta sample that represents a much larger population.The individual samples are sequenced with an error rate below 0.002 per site and the pooled sample then allows us to estimate frequencies far below this threshold.
Why do we care?
We have previously shown that reversion to the consensus is a dominant force in HIV-1 evolution. These reversion mutations are driven by the fitness costs of these mutations. The landscape we determined will allow to look more closely at the driving forces of reversion. Furthermore, the landscape can pin-point regions of vulnerability and target particular regions with unexpected conservation patterns for follow-up analysis.
On a more general note, fitness landscapes and the distribution of effect sizes of mutations are the most important parameters we need to know in order to decide what kind of model of the population genetics is appropriate. We have very little knowledge how these distributions look like for any organism. Our work is one of the first examples where such a landscape has been determined in-vivo on a genome wide scale.